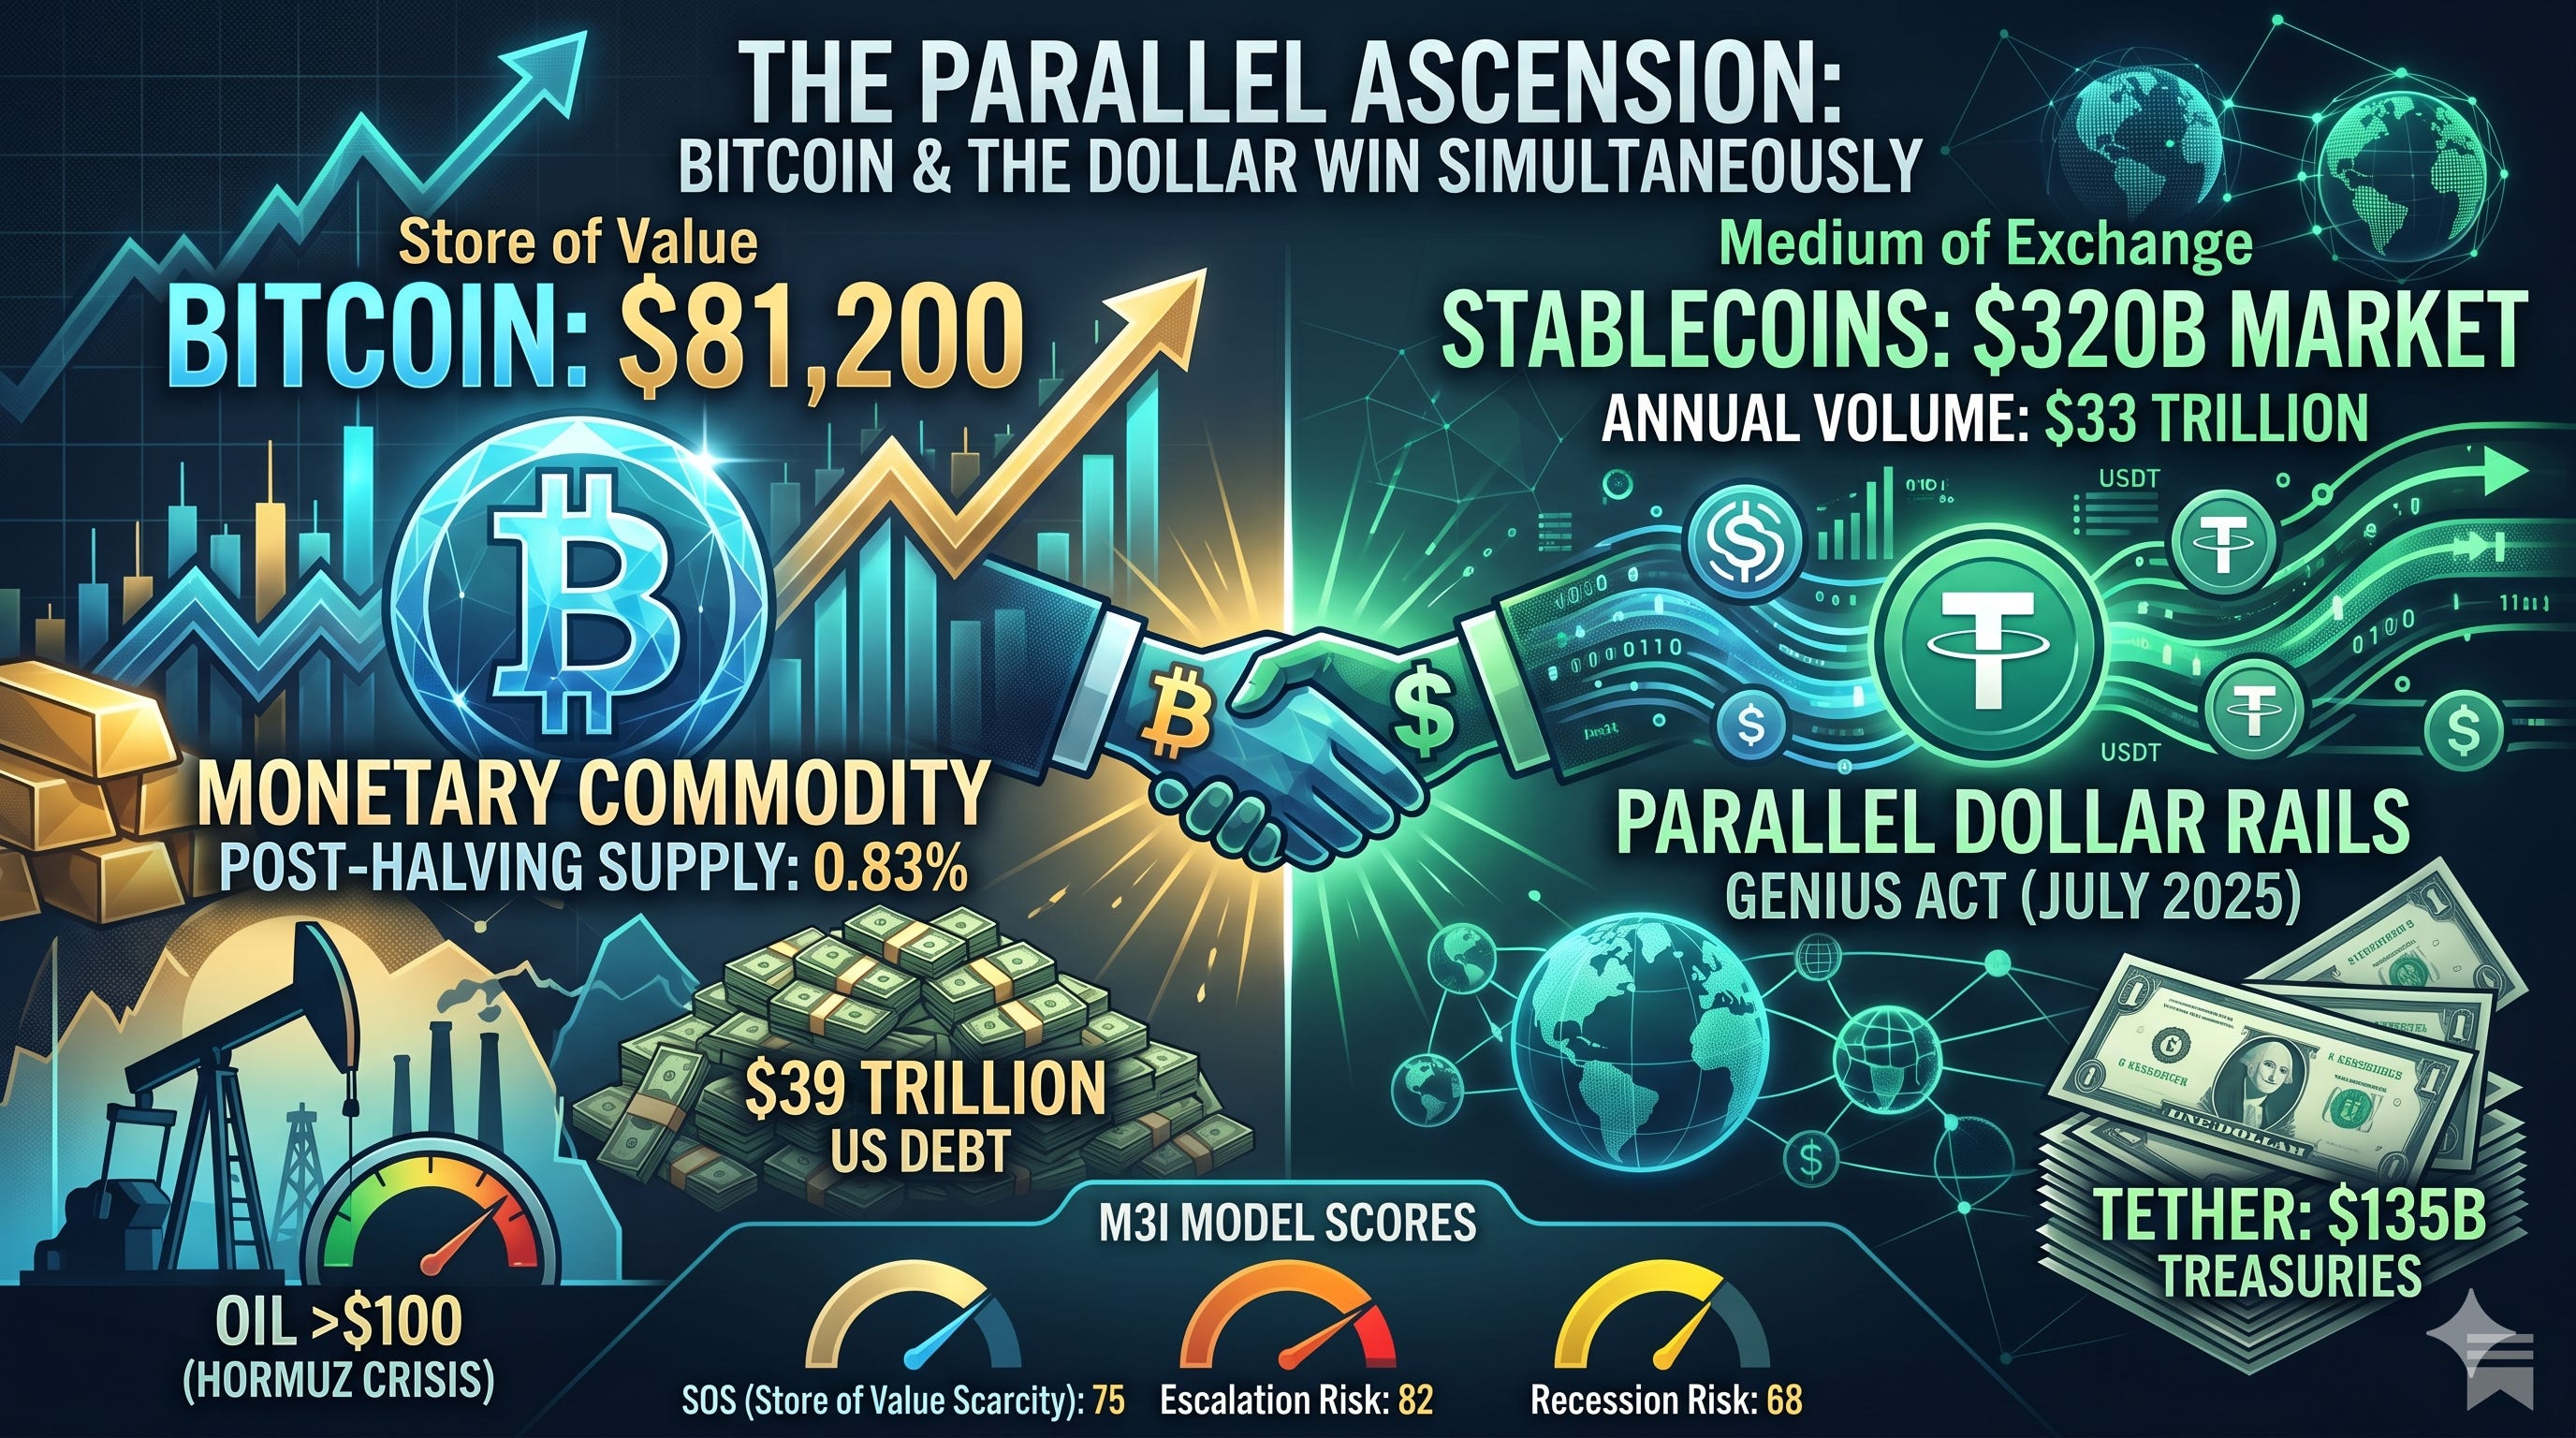
Executive Summary: Bitcoin at $81,200 is no longer trading like a risk asset — it’s trading like a monetary commodity in an environment tailor-made for hard assets. US debt has hit $39 trillion (100.2% of GDP for public debt), the Hormuz crisis has kept oil above $100 for over two months, and the post-halving supply rate sits at just 0.83%. Meanwhile, stablecoins — now a $320 billion market processing $33 trillion annually — aren’t undermining the dollar; they’re extending it, with Tether alone holding $135 billion in US Treasuries. The GENIUS Act (July 2025) formalized this parallel dollar infrastructure. The result is a bifurcating monetary system: store of value migrating to scarce assets (BTC, gold), medium of exchange consolidating on stablecoin-powered dollar rails. Both Bitcoin and the dollar can win simultaneously — and the same inflationary forces driving one are fueling the other. M3I model scores (SOS 75, escalation risk 82, recession risk 68) confirm: the structural pressures aren’t transient, and Bitcoin’s asymmetric payoff profile is positive-expected-value across all three M3I scenarios.
This article is not financial advice. Cryptocurrency carries significant risk, including total loss of principal. Do your own research before making any investment decisions.
There is a moment in every monetary cycle when the old framework stops explaining what markets are actually doing. We may have reached that moment. Bitcoin, the asset that was supposed to collapse alongside every other risk trade when inflation ran hot, is instead sitting at $81,200 while Brent crude trades above $104, gold prints fresh highs above $4,730, and the 10-year yield holds stubbornly near 4.4%. The correlation matrices that worked from 2020 to 2023 are breaking down in real time.
Thanks for reading M3I Research! Subscribe for free to receive new posts and support my work.
The thesis is no longer about whether Bitcoin is a hedge against inflation or a speculative risk asset. It’s about whether we’ve entered a regime where both Bitcoin and the US dollar can strengthen simultaneously — propelled by the same structural forces. The mechanism is hiding in plain sight: stablecoins.
The Inflation Nobody Can Print Away
Start with the fiscal picture, because that’s where the pressure originates.
The United States carries $39 trillion in national debt, a debt-to-GDP ratio of 100.2% for public debt, and a fiscal deficit running at $1.9 trillion — roughly 5.8% of GDP. The Congressional Budget Office projects debt-to-GDP will reach 120% by 2036, surpassing the post-WWII record of 106% by 2030. Interest payments on the national debt now exceed $1 trillion annually — surpassing defense spending for a third consecutive year, running at roughly $88 billion per month. The federal government is, in essence, borrowing to pay the interest on what it already borrowed.
This creates a structural incentive to tolerate inflation. Not hyperinflation — nobody wants Weimar — but a sustained, above-target erosion of purchasing power that quietly reduces the real burden of debt. Financial repression by another name. The Fed currently holds rates at 3.5–3.75% and may cut once or twice more toward 3.0–3.25% under incoming chair Kevin Warsh after Powell steps down May 15, but even that implies real rates hovering near zero against a CPI that shows no signs of retreating to the 2% target the Fed has quietly stopped mentioning in press conferences.
Then add the energy shock. The Strait of Hormuz — through which roughly 20% of the world’s oil supply normally transits — has been operating at approximately 5% capacity for 73 days. The Hormuz shipping crisis, tracked by the M3I Research model at 84 (HIGH), represents what the IEA has called the largest oil supply disruption in history. Brent crude at $104 is not a speculative spike. It is the market pricing in a structural supply deficit with a Pentagon-estimated six-month mine-clearance window even after hostilities cease — and Aramco’s CEO confirmed on May 10 there is “no quick fix” for Hormuz, estimating “a month or two” even with a deal in hand.
Oil above $100 feeds directly into CPI through transportation, food production, petrochemical inputs, and electricity generation. It is the most regressive tax in the economy, and it is being levied during a period when the M3I recession risk model reads 68 (MODERATE). The Fed is caught: cut rates to cushion growth, and you accelerate the very inflation that energy prices are stoking. Hold rates, and you risk cracking a consumer sector already stretched thin.
This is the environment Bitcoin was designed for.
The Halving Meets the Money Printer
In April 2024, Bitcoin underwent its fourth halving, reducing the block reward to 3.125 BTC every ten minutes and dropping the annual supply inflation rate to approximately 0.83%. As of May 2026, over 95% of all Bitcoin that will ever exist has already been mined — the 20 millionth coin was mined on March 9, 2026. Fewer than 1 million BTC remain. The remaining supply will trickle out over the next 114 years.
Compare this to the M2 money supply. Research covering the 2020–2023 period found an 0.78 correlation coefficient between global M2 growth and Bitcoin’s price, with approximately 90-day lag effects. The mechanism is intuitive: when central banks expand the monetary base, the denominator grows; hard assets — gold, real estate, Bitcoin — reprice upward in nominal terms. What the halving does is compress the supply response. Gold miners can increase production when prices rise. Real estate developers can build. Bitcoin’s supply curve is mathematically indifferent to price. The supply schedule does not care that Brent is above $100 or that the deficit is 5.8% of GDP.
A caveat is necessary here: the M2-Bitcoin relationship is not the clean predictor it once was. Since mid-2025, Bitcoin has shown signs of decoupling from its previously tight M2 correlation. US M2 hit a record $22.4 trillion in January 2026, up 4.3% year-over-year, yet Bitcoin has not delivered a clean “M2 expansion = price up” response since August 2025. Part of the problem is measurement itself — “global M2” is notoriously difficult to quantify accurately. Tracking US M2 alone captures roughly 9% of where G4 liquidity growth actually came from over the past year; the rest sits in ECB, PBoC, and BoJ balance sheets, each measured differently, reported on different schedules, and subject to currency translation effects that can distort the aggregate picture. The simple mental model — draw one global M2 line, expect Bitcoin to mirror it with a lag — has not survived the last two years particularly well. Analysts remain divided: Fidelity Digital Assets maintains that Bitcoin bull cycles coincide with M2 acceleration and expects the correlation to reassert as QT ends, while others argue that prolonged decoupling from M2 growth has historically marked major tops.
What appears to be happening is an evolution in the transmission mechanism — liquidity increasingly flows through spot ETFs and stablecoin infrastructure rather than directly through the M2 channel. This does not invalidate the broader relationship between monetary expansion and hard-asset repricing, but it means M2 alone is an incomplete lens. The institutional plumbing that now exists between monetary expansion and Bitcoin means the relationship is more structural and less speculative than in previous cycles — but also harder to time using M2 as a leading indicator.
The institutional response has been telling. US spot Bitcoin ETFs recorded $2.44 billion in net inflows in April 2026 alone, the highest monthly total of the year. BlackRock’s iShares Bitcoin Trust (IBIT) holds approximately 818,000 BTC with roughly $67 billion in assets under management — representing approximately 66% of the entire US spot Bitcoin ETF complex. Institutional participation has grown significantly, up from 24% of holdings at launch to an estimated 38% of total ETF assets — with institutional share of recent inflows running even higher. Bitcoin ETFs collectively control 6.3% of total circulating supply. These are not retail speculators chasing momentum. These are pension funds, endowments, and sovereign wealth allocators making deliberate decisions about portfolio construction in an inflationary regime.
Bitcoin at $81,200 with turbulence at 71 (ELEVATED) is not acting like a risk asset. It is acting like a monetary commodity — something closer to digital gold than to a leveraged tech bet. And critically, it is holding this level even as the M3I composite has come down from its crisis peaks — suggesting the bid is likely structural, not panic-driven.
The Stablecoin Paradox
Here is where the narrative gets interesting, and where most Bitcoin commentary misses the point entirely.
The standard Bitcoin bull case treats the dollar as the antagonist — fiat currency debased by reckless fiscal policy, slowly losing its grip as the world’s reserve currency. There is truth in that framing, but it obscures a far more consequential development: stablecoins are not replacing the dollar. They are extending it.
Tether (USDT) has a market capitalization of approximately $187 billion. USDC sits at $77 billion. Together with a growing cohort of smaller issuers, the stablecoin market now exceeds $320 billion in total capitalization — up from $265 billion less than a year ago. Every one of these tokens must be backed, under the terms of the GENIUS Act signed into law in July 2025, by dollar-denominated reserves. In practice, this means US Treasuries.
Tether alone holds over $135 billion in US Treasuries, making it the 17th largest holder of US government debt globally — ahead of South Korea. The stablecoin sector as a whole has become one of the most significant structural buyers of short-term US government paper, with Tether’s direct holdings representing approximately 1.6% of all outstanding Treasury bills. Every time someone in Lagos, Manila, Buenos Aires, or Istanbul converts their local currency to USDT to escape inflation or facilitate a cross-border payment, they are — through the mechanics of reserve requirements — creating demand for US government debt.
The numbers are staggering. Stablecoin transaction volume hit $33 trillion in 2025, dwarfing Visa’s roughly $14 trillion in annual payment volume — and Q1 2026 alone recorded $28 trillion, putting the annualized pace well above $100 trillion. Seventy-one percent of Latin American firms now report using stablecoins for cross-border payments. B2B stablecoin payments surged from under $100 million per month in early 2023 to over $6 billion per month by mid-2025 — a 60x increase in 30 months. This is not a niche. This is a parallel financial system being built on dollar rails, operating 24/7, settling in minutes rather than days, and reaching populations that traditional banking infrastructure has never served.
The GENIUS Act — the Guiding and Establishing National Innovation for US Stablecoins Act — formalized this relationship. Passed by the Senate 68–30 on June 17, by the House 308–122 on July 17, and signed by Trump on July 18, the legislation mandates 1:1 reserve backing with liquid assets and establishes a permitting framework for issuers — including both insured depository institutions and qualifying state-licensed nonbank entities — effectively turning stablecoin issuers into a new class of narrow banks whose primary asset is US government paper. It is, in regulatory terms, the most significant expansion of dollar infrastructure since the eurodollar market of the 1960s.
And this is the paradox: the same inflationary forces that drive people toward Bitcoin also drive them toward stablecoins, and stablecoins strengthen the dollar. A farmer in Argentina who lived through 200%+ peso inflation in 2023–2024 doesn’t buy Bitcoin to pay his suppliers — he buys USDT. That transaction creates marginal demand for Treasuries. Multiply that by millions of users across emerging markets, and you get a structural bid for US government debt that did not exist five years ago.
Two Sides of the Same Coin
The Bitcoin maximalist and the dollar hegemonist are both half right.
Bitcoin is winning because the fiscal math demands inflation, and inflation demands hard assets. Every deficit dollar that goes unaddressed, every month the Hormuz crisis persists, every basis point of real yield that turns negative — all of it flows uphill to an asset with a supply cap of 21 million.
The dollar is winning because the infrastructure of global commerce is being rebuilt on stablecoin rails, and stablecoins need Treasuries the way the eurodollar system needed correspondent banking. The US government doesn’t need to enforce dollar hegemony through aircraft carriers alone — though, as the current Hormuz standoff demonstrates, those help. It can enforce it through regulatory architecture that makes dollar-denominated stablecoins the path of least resistance for a world that desperately needs a reliable medium of exchange.
These two forces are not in tension. They are in symbiosis.
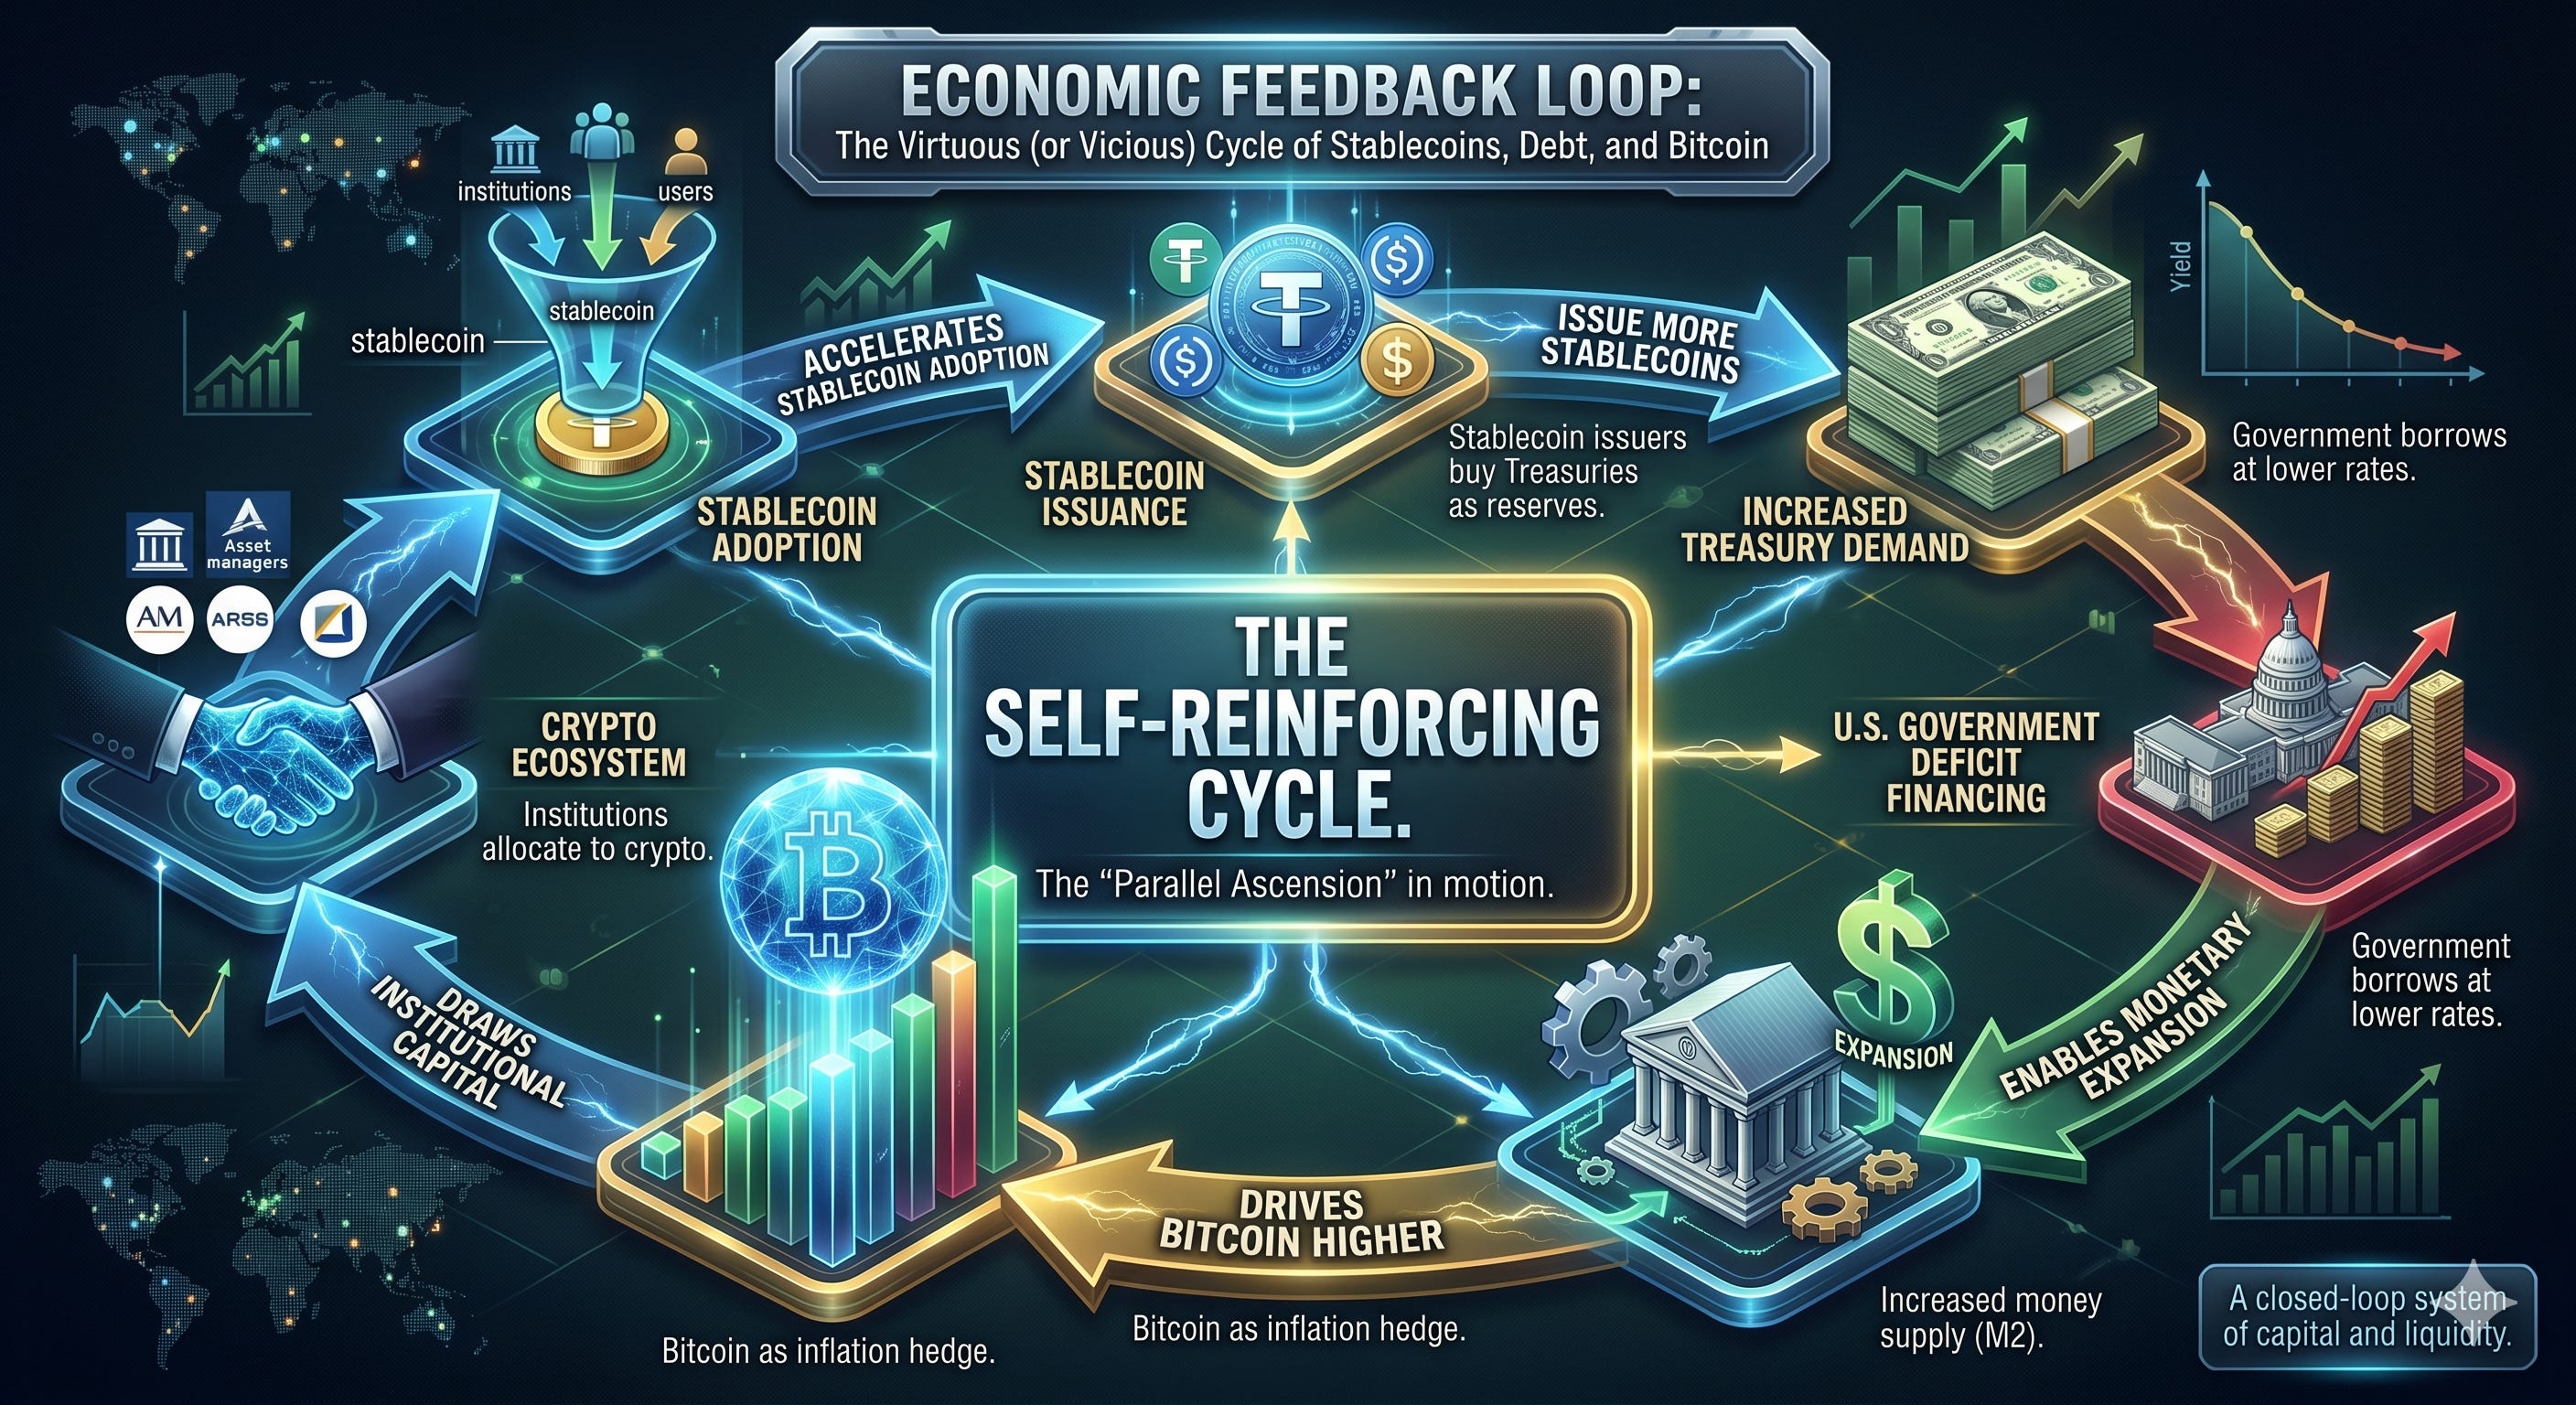
When the Fed eventually cuts further — and with recession risk at 68 and the fiscal position deteriorating, further easing remains a question of when, not if — M2 will expand. Bitcoin, with its post-halving supply compression and deepening institutional infrastructure, will reprice upward — though the transmission mechanism now runs increasingly through ETF flows and stablecoin liquidity rather than the direct M2 correlation of earlier cycles. Simultaneously, stablecoin issuance will grow, because lower rates make dollar-denominated assets more attractive relative to higher-yielding but riskier emerging market alternatives, and because the regulatory clarity provided by the GENIUS Act removes the overhang that kept institutional capital on the sidelines.
The cycle reinforces itself. More stablecoin issuance means more Treasury demand, which helps the US government finance its deficits at lower rates, which enables more monetary expansion, which drives Bitcoin higher, which draws more institutional capital into the crypto ecosystem, which accelerates stablecoin adoption.
What the M3I Model Sees
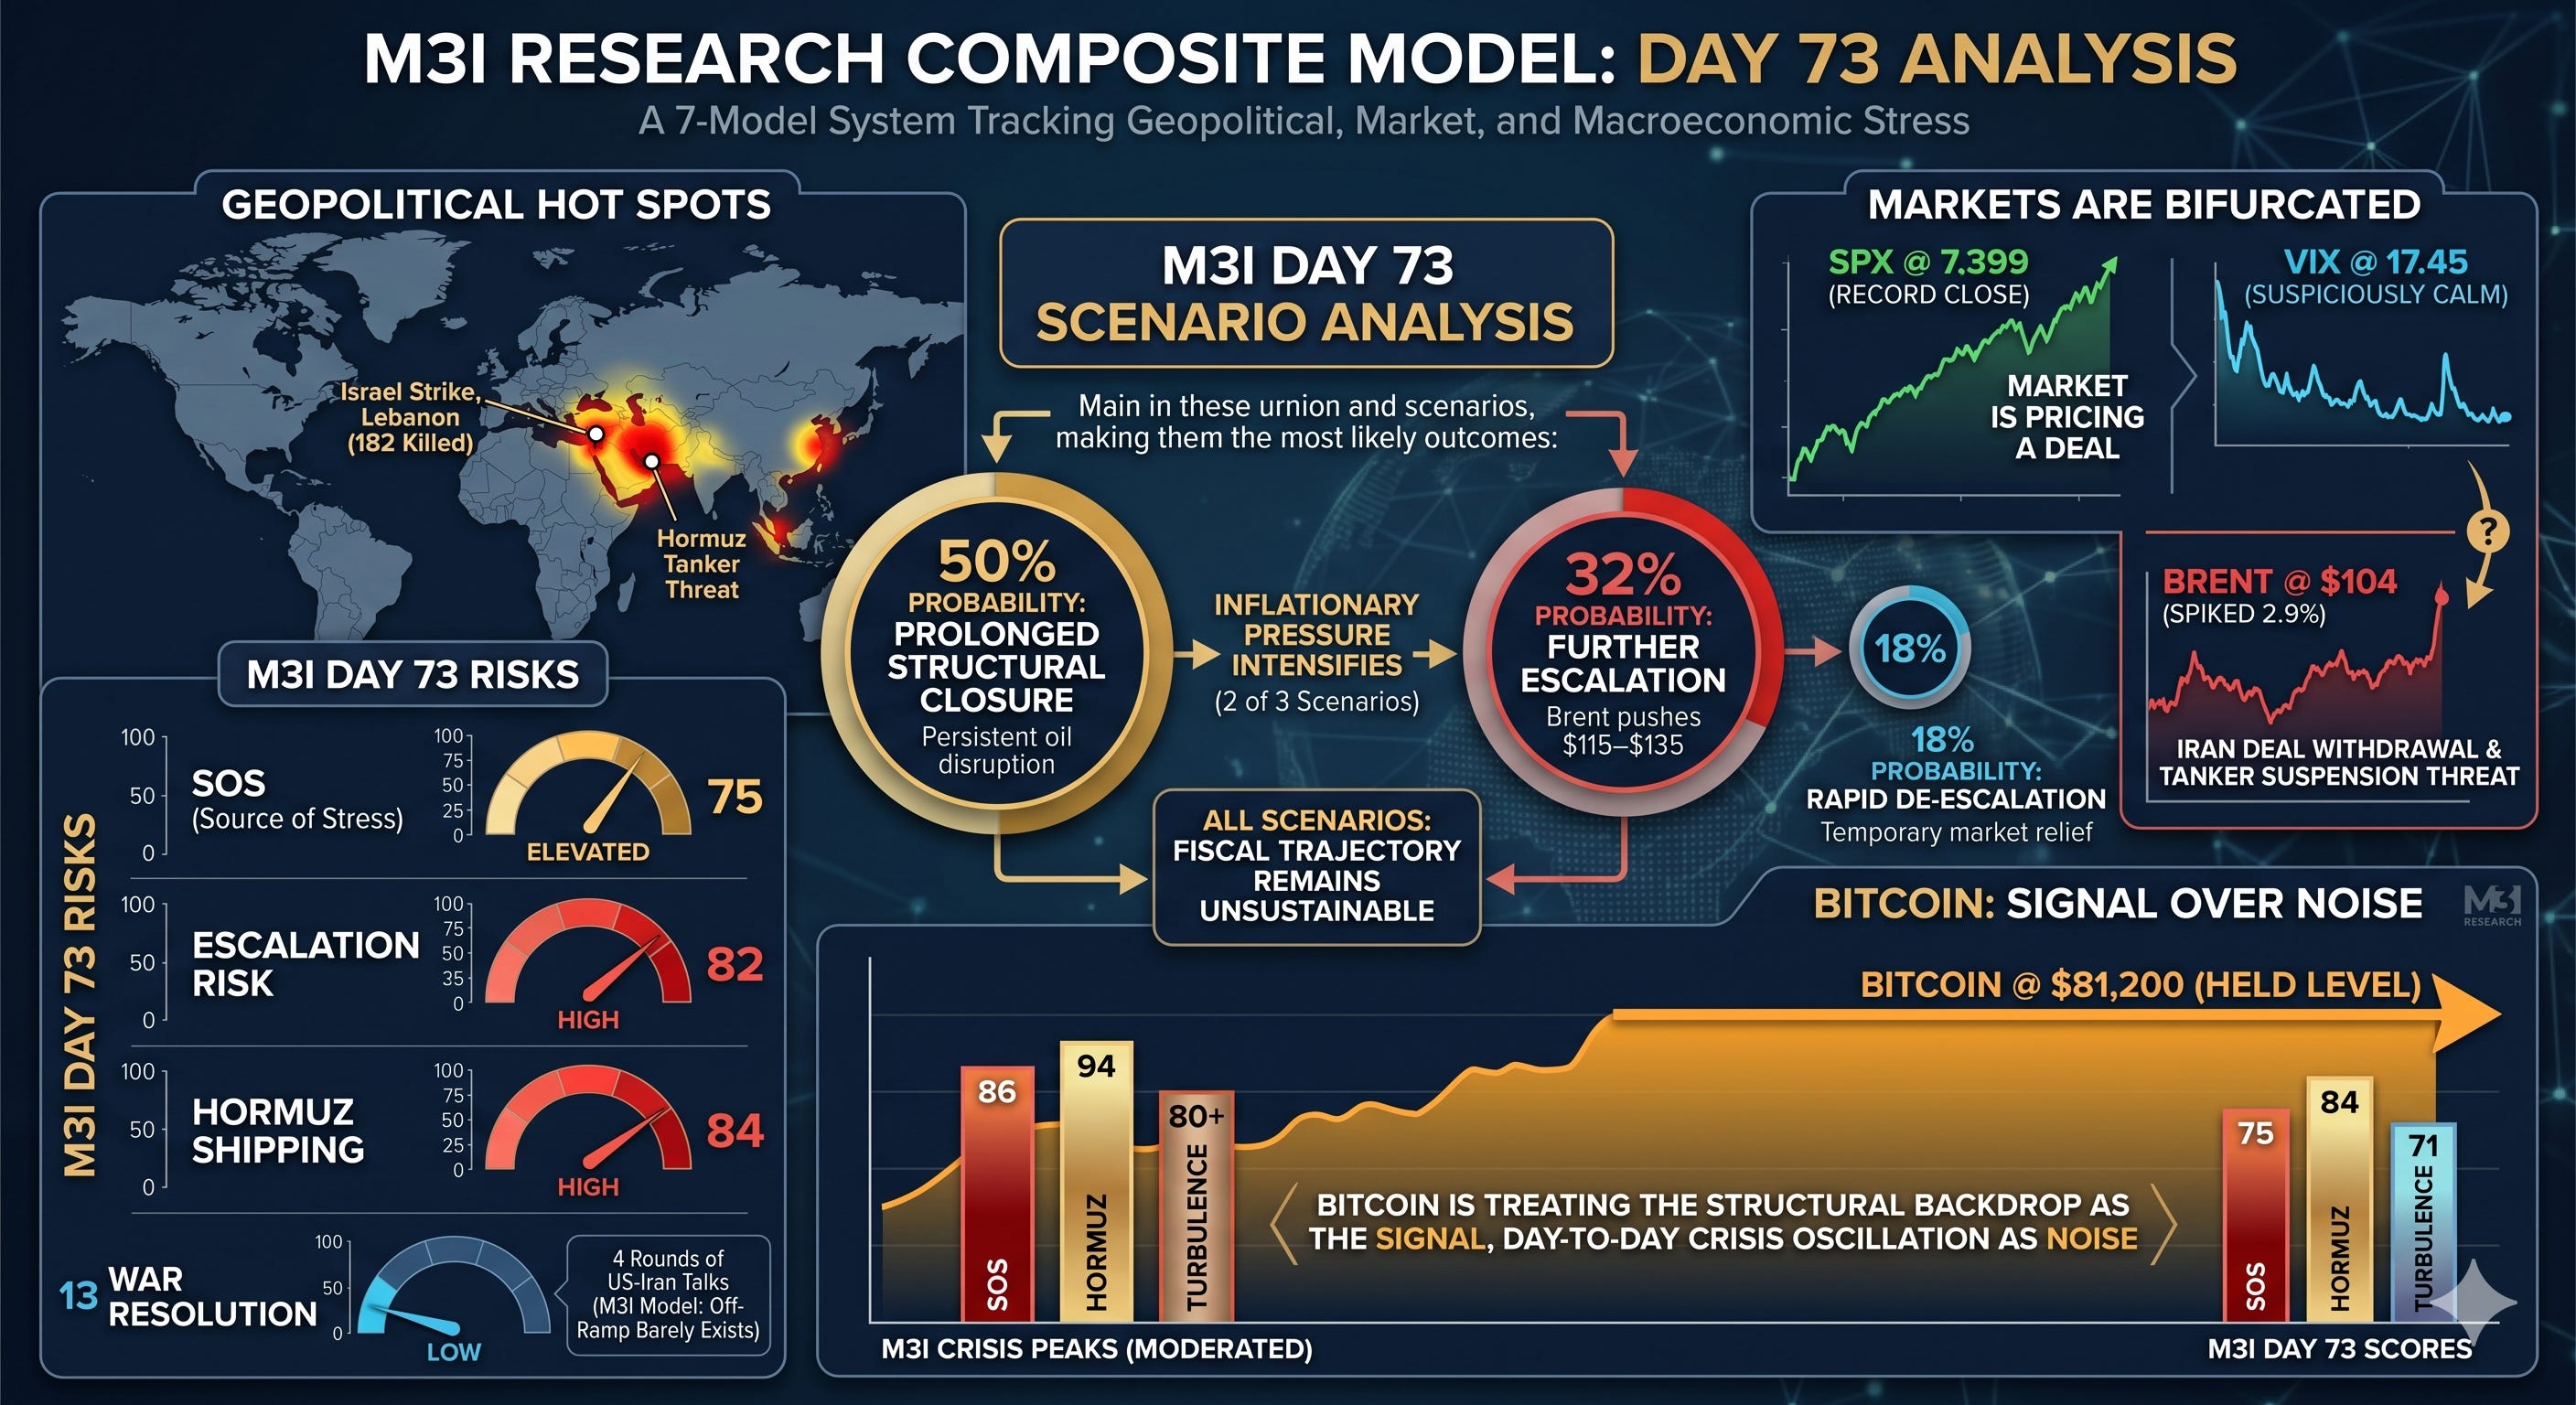
The M3I Research composite model — a 7-model system tracking geopolitical risk, market turbulence, and macroeconomic stress — tells a clear story on Day 73. The SOS sits at 75 (ELEVATED), escalation risk at 82 (HIGH), Hormuz shipping at 84 (HIGH), and war resolution at just 13 (LOW) despite four rounds of US-Iran negotiations. Markets are split: SPX at 7,399 just printed a record close and VIX at 17.45 looks suspiciously calm, while Brent spiked 2.9% to $104 after Israel’s deadliest single-day strikes in Lebanon (182 killed) triggered Iran to threaten both deal withdrawal and Hormuz tanker-traffic suspension. The market is pricing a deal. The model says the off-ramp barely exists.
The scenario analysis makes the asymmetry explicit: 18% probability of rapid de-escalation, 50% prolonged structural closure, 32% further escalation with Brent pushing $115–135. In two of three scenarios, inflationary pressure intensifies. In all three, the fiscal trajectory remains unsustainable. And Bitcoin at $81,200 has held its level even as M3I scores have moderated from their crisis peaks — SOS down from 86 to 75, Hormuz from 94 to 84, turbulence from the 80s to 71. If Bitcoin were merely a crisis proxy, it would have sold off with those scores. It hasn’t. It is treating the structural backdrop as the signal and the day-to-day crisis oscillation as noise.
The Road Ahead
There is a version of the future where all of this unwinds. The Hormuz crisis resolves. Oil retreats to $80. The Fed threads the needle on rates. The deficit shrinks. In that world, Bitcoin’s narrative as an inflation hedge becomes less compelling, and the speculative premium compresses.
But that world requires a series of best-case outcomes that the data does not support. The M3I war resolution score of 13 says the crisis is not ending soon — and the most recent Oman Round-4 talks concluded “difficult but useful” with no breakthrough, Iran reiterating nuclear enrichment as “non-negotiable.” The fiscal deficit of 5.8% of GDP says the borrowing is not slowing. The 95%+ supply issuance of Bitcoin says the scarcity is only increasing. And the $320 billion stablecoin market — processing $28 trillion in Q1 2026 alone — says the dollar’s new distribution network is already built and operating at a scale that dwarfs traditional payment rails.
The Convergence: AI, Tokenization, and the Scarcity Stack
There is one more layer to this thesis, and it may be the most important.
The defining technological buildout of the next decade is artificial intelligence, and AI runs on two things: chips and power. NVIDIA’s Blackwell-generation GPUs ship into a market where demand outstrips supply by an order of magnitude — the company shipped roughly 25,000–35,000 NVL72 rack-scale systems in 2025, yet hyperscaler demand for Blackwell-generation compute far exceeds available supply. Global data center electricity consumption is projected by the IEA to double to roughly 945 TWh by 2030, with AI-optimized facilities quadrupling their share. Microsoft, Google, Amazon, and Meta are collectively spending north of $700 billion in 2026 on AI infrastructure — and the bottleneck is not software. It is electricity and silicon.
This creates a scarcity stack that mirrors Bitcoin’s own logic. Chips are scarce because fabrication capacity at the leading edge (TSMC 3nm, 2nm) is physically constrained. Power is scarce because permitting a new gas plant or grid interconnection takes 3–5 years, and the AI buildout needs it now. The companies solving both problems simultaneously — hyperscalers securing nuclear PPAs, Bitcoin miners pivoting their power assets to AI cloud — are building the physical layer of the next economy. IREN is the live example: an Australian Bitcoin miner reborn as a 2 GW AI infrastructure company, with a $9.7 billion Microsoft contract and a $3.4 billion NVIDIA deal to deploy next-generation GPU cloud across its Sweetwater and Childress campuses in Texas. The convergence is not metaphorical. The same megawatt that mines Bitcoin today trains a frontier model tomorrow. The same chip shortage that constrains AI training constrains everything else downstream.
And here is where tokenization closes the loop. BlackRock’s BUIDL fund — a tokenized US Treasury money market fund launched in March 2024 — has reached $2.85 billion in assets and commands over 40% of the tokenized Treasury market. Tokenized real-world assets (RWAs) have surged past $26 billion on-chain, up fourfold year-over-year. Franklin Templeton, Apollo, and Hamilton Lane are tokenizing credit, private equity, and fund shares on blockchain rails. The same stablecoin infrastructure that processes $28 trillion per quarter is becoming the settlement layer for traditional finance — not in theory, not in a whitepaper, but in production, with real AUM, real redemptions, and real institutional allocators.
The pattern is the same at every layer. AI needs chips and power — both scarce, both appreciating. Tokenization needs stablecoins and blockchain settlement — both growing, both backed by Treasuries. Bitcoin needs nothing except the continuation of the fiscal and monetary trends that every government on earth is structurally committed to. Each layer reinforces the others. AI drives power demand, which drives energy prices, which drives inflation, which drives demand for hard assets. Tokenization extends dollar infrastructure, which finances the deficit, which enables more expansion, which drives more tokenization. Bitcoin sits at the apex — the only asset in the stack with a supply curve that cannot respond to any of it.
This is not a trade. It is a regime change. The monetary system is bifurcating — store of value migrating to assets with credible scarcity (gold, Bitcoin), medium of exchange consolidating on stablecoin-powered dollar rails, and the physical economy reorganizing around the scarcity of chips, power, and compute. The two functions that economists once insisted must coexist in a single currency are separating, and the separation is accelerating under the combined pressure of inflation, geopolitical instability, fiscal deterioration, and the largest infrastructure buildout since electrification.
The halvings keep coming. The deficits keep growing. The stablecoins keep buying Treasuries. The data centers keep demanding power. And Bitcoin keeps climbing — not despite the chaos, but because of it.
The M3I Research model provides daily composite scoring across 7 analytical models tracking geopolitical risk, market turbulence, recession probability, and conflict resolution. Current scores and methodology available at m3iresearch.com. API access: github.com/m3iresearch8/m3i-api.
Disclaimer: This article is for informational and analytical purposes only and does not constitute financial, investment, tax, or legal advice. The views expressed are those of M3I Research and do not represent a recommendation to buy, sell, or hold any asset. Cryptocurrency and digital assets are highly volatile and carry significant risk, including total loss of principal. Past performance is not indicative of future results. M3I model scores are algorithmic outputs based on publicly available data and editorial judgment; they are not predictions and should not be relied upon as the sole basis for any investment decision. Readers should conduct their own independent research and consult with a qualified financial advisor before making any investment decisions. M3I Research, its authors, and affiliates may hold positions in assets discussed in this article. All M3I scores reflect model outputs as of May 11, 2026.
Thanks for reading M3I Research! Subscribe for free to receive new posts and support my work.