How High Is Too High?
Two time-tested frameworks from Peter Lynch and Stanley Druckenmiller — applied to four AI stocks at the center of the infrastructure build.

Executive Summary
AI stocks have delivered remarkable returns. The instinct is to ask whether it is too late. This article reframes the question using two time-tested investment frameworks — Peter Lynch’s growth-relative valuation and Stanley Druckenmiller’s macro discipline — and applies them to four stocks at the heart of the AI infrastructure build: Micron ($MU), SanDisk ($SNDK), Coherent ($COHR), and Corning ($GLW). The conclusion: some of these names remain undervalued by the standards of investors who have been doing this for decades. Others have moved beyond what the current growth justifies. The difference is not obvious from the price alone.
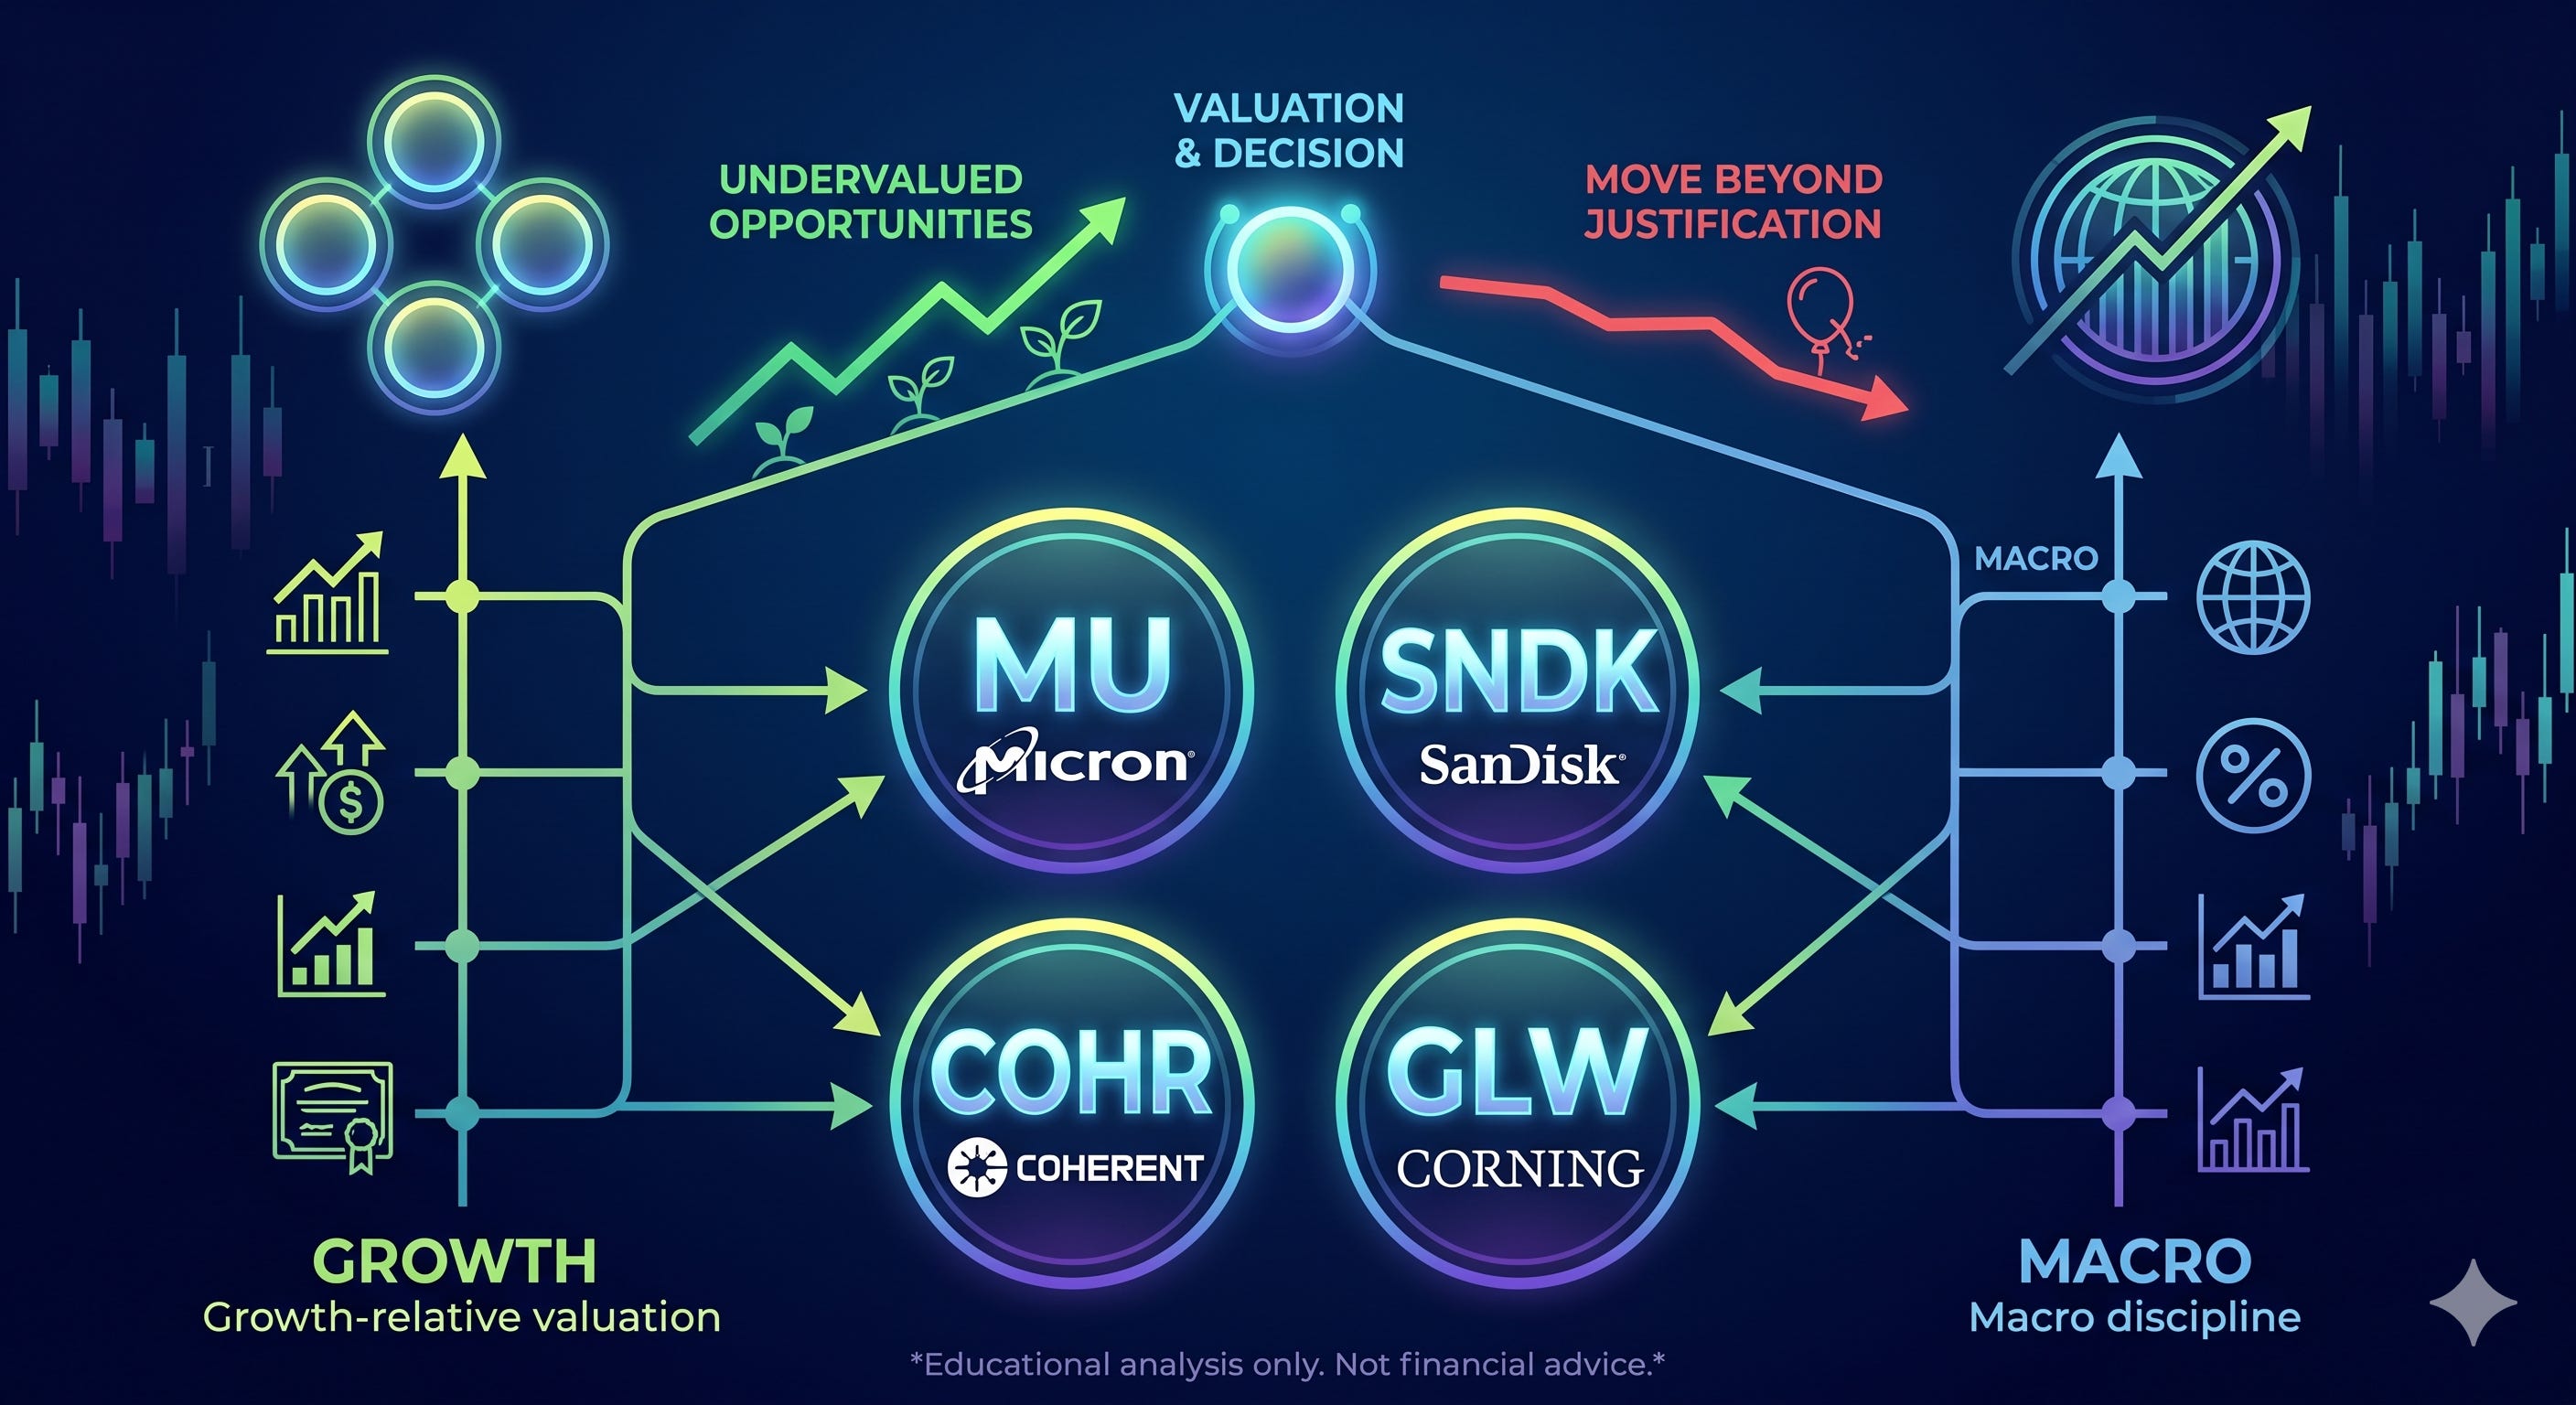
Not financial advice. Educational analysis only.
The Question Behind the Question
When a stock triples in a year, the natural reaction is that you have missed it. The chart looks like it belongs to someone else’s story.
But price alone is incomplete information. It is like judging the depth of a river by how fast the surface is moving. You need to look underneath.
Two investors — separated by style, geography, and temperament — built careers around this idea. Peter Lynch, a stock picker from Boston, and Stanley Druckenmiller, a macro trader from Pittsburgh. One looked at companies. The other looked at the world. Both arrived at the same insight:
A stock is only expensive or cheap relative to what is actually happening inside the business and around it. Without that context, the price is just a number.
Lynch: The Growth Test
Peter Lynch managed Fidelity’s Magellan Fund for thirteen years and averaged 29% annual returns. If you had invested $10,000 when he took over in 1977 and held until he retired in 1990, you would have walked away with roughly $280,000. His method was simple enough to explain in a sentence: compare the price you are paying to the rate at which the company is growing.
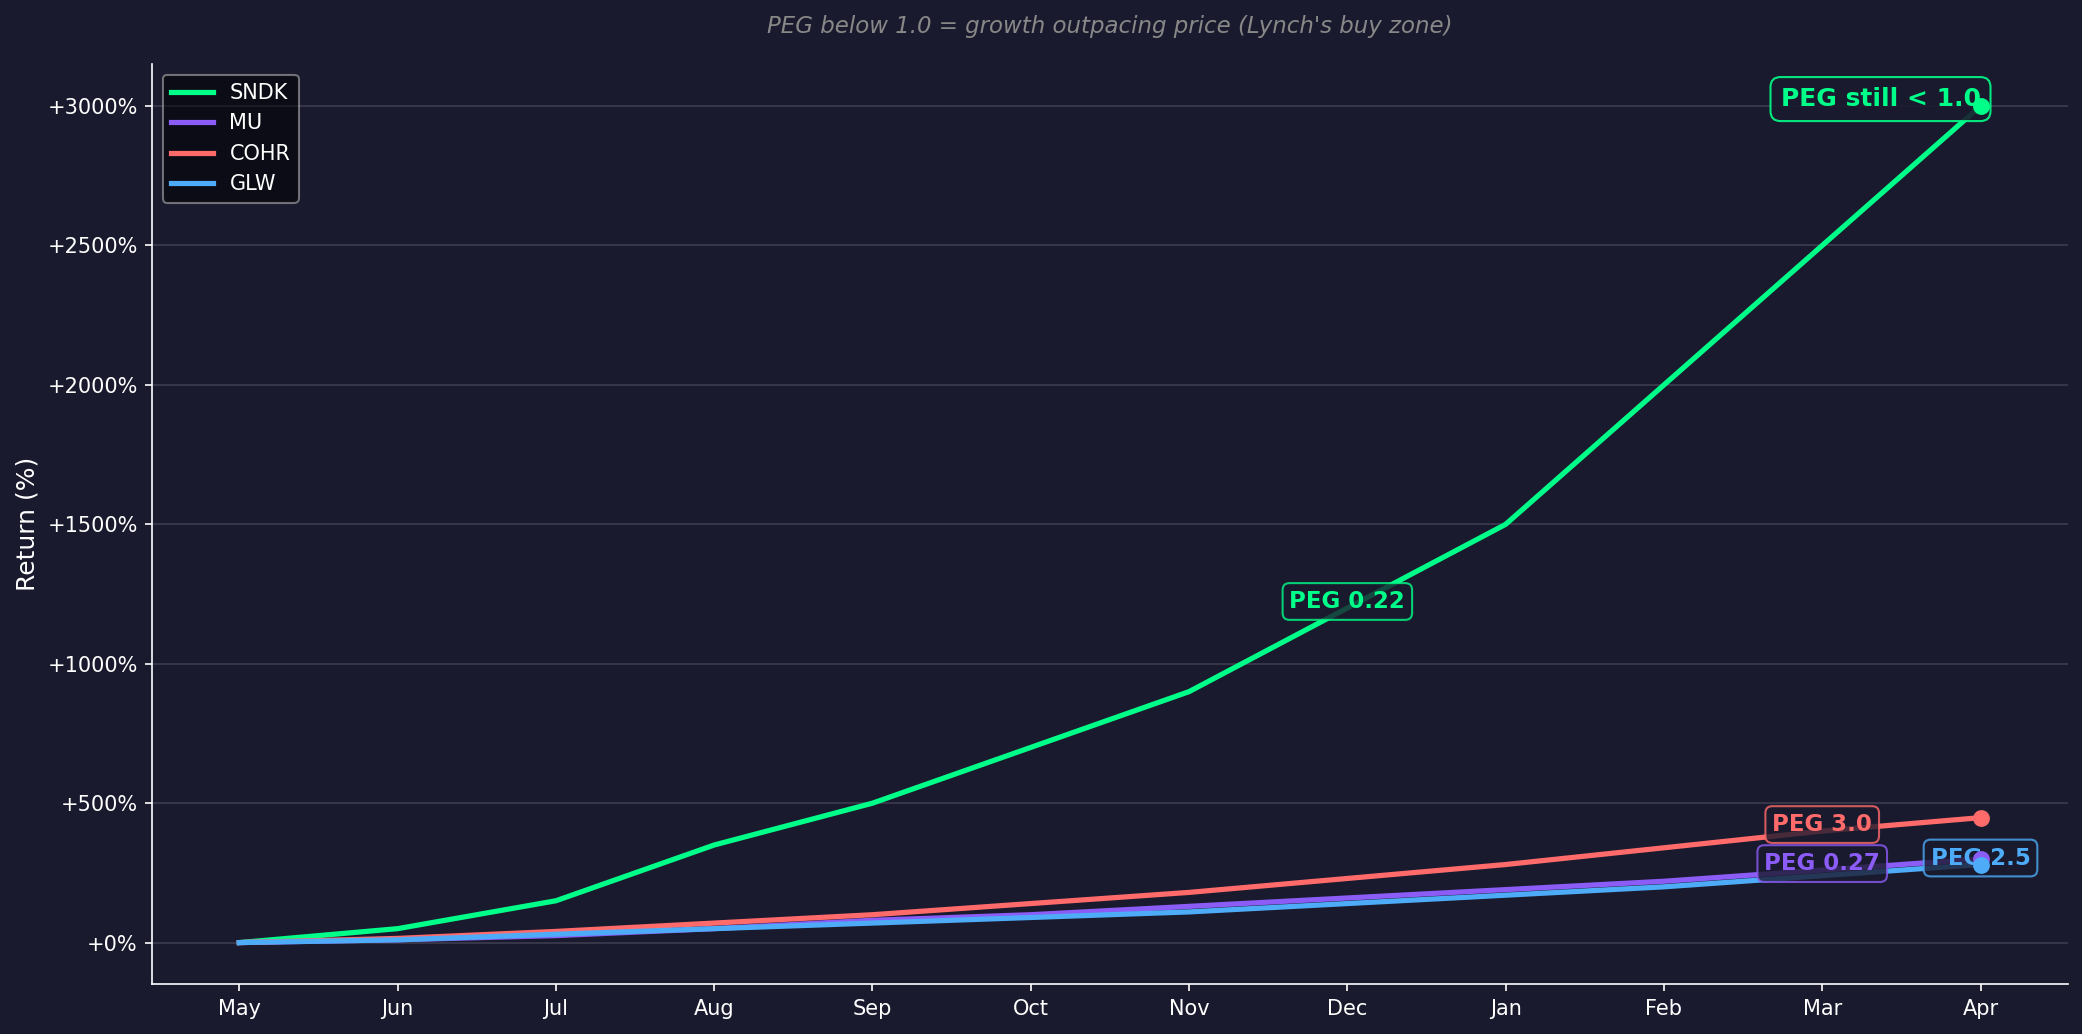
He captured this in the PEG ratio — the stock’s price-to-earnings multiple divided by its projected long-term earnings growth rate, typically the consensus 3-5 year forward estimate. When the PEG is below 1.0, the growth is outpacing the price. When it climbs above 1.0, the price has gotten ahead of the growth.
It is a calm, mathematical way to cut through the noise. It does not care about headlines, sentiment, or what the chart looks like. It only asks one question: is the business growing fast enough — not this quarter, but over the next several years — to justify what the market is charging for it today?
Four AI Stocks Through Lynch’s Lens
Micron ($MU) trades at roughly 8x forward earnings. Analysts project long-term EPS growth of approximately 30% annually over the next 3-5 years, driven by a structural shortage in High Bandwidth Memory — the type of memory that AI systems consume in enormous quantities. That gives MU a PEG ratio of approximately 0.27. By Lynch’s framework, this is one of the most attractively priced growth stocks in the market. The price has moved, but the growth has moved faster.
SanDisk ($SNDK) trades at approximately 10x forward earnings on current-year estimates. The company just beat Q3 earnings estimates by 63%, posting $23.41 per share against expectations of $14.36. FY2027 consensus EPS has climbed to roughly $92 per share. Given the trajectory of NAND demand for AI inference workloads, even a conservative 3-5 year growth estimate of 45% puts the PEG ratio near 0.22. The stock has returned over 3,000% since its spinoff from Western Digital — a number that sounds impossible until you see the growth underneath it. Lynch wrote about stocks like this. The ones that look expensive on a chart and cheap on a spreadsheet.
Coherent ($COHR) sits in a more nuanced position. The datacenter segment is growing at 34% and now represents 72% of total revenue, with a 4x book-to-bill ratio — orders arriving four times faster than shipments. But the stock has rallied over 448%, and the forward P/E has expanded to approximately 45x. Using a normalised long-term growth rate of around 15%, the PEG ratio now sits near 3.0 — well above Lynch’s fair value line. The execution is strong, but the market has already rewarded it aggressively. At this level the margin for error is thin. A stock where the next few quarters of execution matter more than the thesis.
Corning ($GLW) is where Lynch’s framework raises a flag. The forward P/E is approximately 54x. Analysts project long-term EPS growth of roughly 22% — solid, but nowhere near enough to justify that multiple. The PEG ratio lands near 2.5. Sales grew 18% last quarter and earnings grew 30%, but the price has already priced in far more than what the growth rate currently supports. The optical fiber thesis for AI data centers is real, but the market has built years of future growth into today’s price.
A note on PEG methodology. The PEG ratios above use Lynch’s preferred approach: the stock’s forward P/E divided by the consensus 3-5 year annualised EPS growth rate. This is the long-term estimate — not last quarter’s growth, not next quarter’s guidance, but the market’s best guess at where earnings will compound over the next several years. Lynch favoured this longer horizon because it smooths out the noise of any single quarter and asks a more durable question: is the business growing fast enough, over a meaningful stretch of time, to justify today’s price? The forward P/E and growth estimates used here reflect Wall Street consensus as of early May 2026. They will shift. The framework does not change.
The picture is not uniform. The memory names — MU at a PEG of 0.27 and SNDK near 0.22 — remain deeply undervalued by Lynch’s standards. Coherent and Corning, with PEGs of 3.0 and 2.5 respectively, have outrun their growth.
Druckenmiller: The World Around the Stock
Stanley Druckenmiller spent thirty years managing Duquesne Capital without posting a single losing year. Where Lynch looks inside the company, Druckenmiller looks at the world the company operates in.
His discipline is to think 18 months ahead. Not about the company — about the environment. Where is monetary policy going? Where is liquidity flowing? What are the dominant secular forces, and have they been priced in already?
His view is that earnings do not move markets. The Federal Reserve does. Liquidity does. A great company in a tightening liquidity environment can still see its stock decline. A mediocre company riding a wave of easy money can look like a genius.
This is why, in late 2024, Druckenmiller sold his entire Nvidia position and exited Palantir — two of the most celebrated AI stocks. Not because the businesses were broken, but because he believed the market had already priced in the next phase of AI growth. He rotated quietly into cheaper names where the growth was real but the expectations had not yet caught up.
His observation was measured: AI may be slightly overhyped in the near term, but underhyped over the long term. The trend is intact. The question is whether the market is paying today for growth that arrives this year — or for growth that may take until 2030.
The Macro Landscape in May 2026
AI capital spending is projected at over $650 billion this year. That is not speculation — it is committed expenditure by hyperscalers building the infrastructure that companies like MU, SNDK, COHR, and GLW supply. The demand pipeline is real.
But the broader environment carries weight. Rates remain elevated. The Iran-US conflict has pushed oil into the $100-120 range and disrupted shipping through the Strait of Hormuz. The Federal Reserve has limited room to ease. Liquidity is not as abundant as it was during the 2023-2024 rally.
Druckenmiller’s framework does not predict whether these stocks go up or down. It provides context. The tailwind is still there, but it is not as strong as it was a year ago. Investors who are positioned in stocks where growth is contractually committed — where demand is backed by signed purchase orders and capital budgets — are better insulated than those holding names where the growth relies on continued multiple expansion.
Two Lenses, One Picture
The value of applying both frameworks is that each covers the other’s blind spot.
Lynch tells you whether the price makes sense relative to the growth. Druckenmiller tells you whether the world is set up for that growth to continue.
MU and SNDK pass both tests. PEG ratios of 0.27 and 0.22 — well below fair value. Demand backed by committed AI infrastructure spending. These are companies where the business is growing faster than the market is pricing.
COHR gets a pass from Druckenmiller — the growth is there, the backlog provides visibility, and AI infrastructure spending is committed. But Lynch’s test tells a different story. A 448% rally has pushed the PEG to 3.0. The execution is strong, but the price has already absorbed much of the upside.
GLW does not pass Lynch’s test at current prices. A PEG of 2.5 means the market is paying for growth the company has not yet delivered. Even if the thesis plays out over time, the entry point matters — and at 54x forward earnings with 22% projected growth, the math does not balance.
The Right Question
The question was never “is it too late?” That framing assumes AI is one trade with one answer.
It is not. It is a collection of individual businesses, each with its own growth trajectory, valuation, and sensitivity to the broader environment. Some have room to run. Others have already priced in the destination.
Lynch would say: do the math. Let the growth rate tell you what the price should be.
Druckenmiller would say: read the room. Understand the world your investment lives in.
Both of them, in their own way, are saying the same thing. Look past the noise. Find the signal. And have the patience to let it play out.
M3I Research — free at m3iresearch.substack.com
See what others don’t.
Disclaimer
This article is published by M3I Research for educational and informational purposes only. It does not constitute financial advice, investment advice, trading advice, or any other kind of advice, and should not be relied upon in making any investment or financial decision.
The author may hold positions in the securities discussed. All opinions expressed are the author’s own and do not represent the views of any affiliated organisation. Past performance of any stock, index, or investment strategy is not indicative of future results.
The PEG ratios, forward P/E multiples, earnings estimates, and growth projections cited in this article are derived from publicly available Wall Street consensus data as of early May 2026. These figures change frequently and may not reflect current values at the time of reading. Readers should verify all data independently before making any investment decisions.
Investing in equities involves risk, including the potential loss of principal. You should consult a qualified financial advisor before making any investment.
M3I Research is not a registered investment advisor, broker-dealer, or financial institution.