The Quiet Gap
Why our turbulence model and the VIX are telling two different stories — and what it might mean.

Executive summary
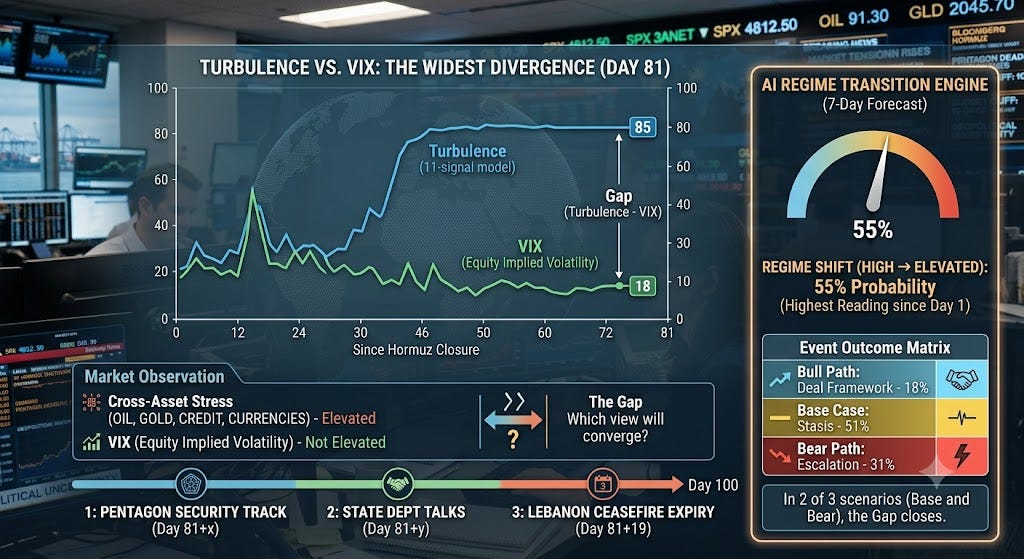
Our 11-signal turbulence model reads 85. The VIX reads 18. That’s the widest divergence since the Hormuz closure began 81 days ago. This article explores what might explain the gap, why it matters, and how it could resolve.
Key observations:
• Cross-asset stress (oil, gold, credit, currencies) is elevated. Equity implied volatility is not. One of these views will converge toward the other.
• The AI regime engine estimates a 55% probability of a regime transition (HIGH → ELEVATED) within 7 days — the highest reading since Day 1.
• Three catalytic events in the next 19 days (Pentagon Security Track, State Dept talks, Lebanon ceasefire expiry) could resolve the gap in either direction.
• The model has a documented track record of 6 confirmed calls out of 7 over 81 days — including calling the April 7 ceasefire seven days early and flagging the Islamabad talks collapse at 81% probability when consensus expected a deal.
• The model assigns 18% to a bull path (deal framework), 51% to the base case (stasis), and 31% to a bear path (escalation). In two of three scenarios, the gap closes.
There’s a number we’ve been watching for weeks that we think deserves a longer conversation. It’s not any single score or index. It’s the distance between two of them.
Our turbulence composite — an 11-signal model that aggregates stress across oil, currency, credit, and geopolitical channels — currently reads 85. The VIX, which measures implied volatility on S&P 500 options, is at 17.82.
That’s a wide gap. Historically wide. And we think it’s worth understanding what it might be telling us, even if we can’t know for certain.
—
Two instruments, two different views
The VIX and the turbulence composite are measuring different things. The VIX reflects what equity options traders are willing to pay for downside protection. It’s responsive to earnings risk, Fed policy, and recession expectations — the kinds of risks that have well-established pricing models.
The turbulence composite casts a wider net. It incorporates Brent crude implied volatility, the dollar-gold divergence, emerging market credit spreads, shipping lane disruption data, diplomatic signal momentum, and military posture indicators, among others. Some inputs are quantitative and update in real time. Others are qualitative and update when verified events occur.
When these two measures agree, the signal is straightforward — either stress is broadly elevated or it isn’t. When they diverge this sharply, it suggests that stress is concentrating in certain channels (oil, geopolitics, credit) while equity markets remain relatively insulated. The interesting question is how long that insulation can hold.
—
A brief note on the model’s track record
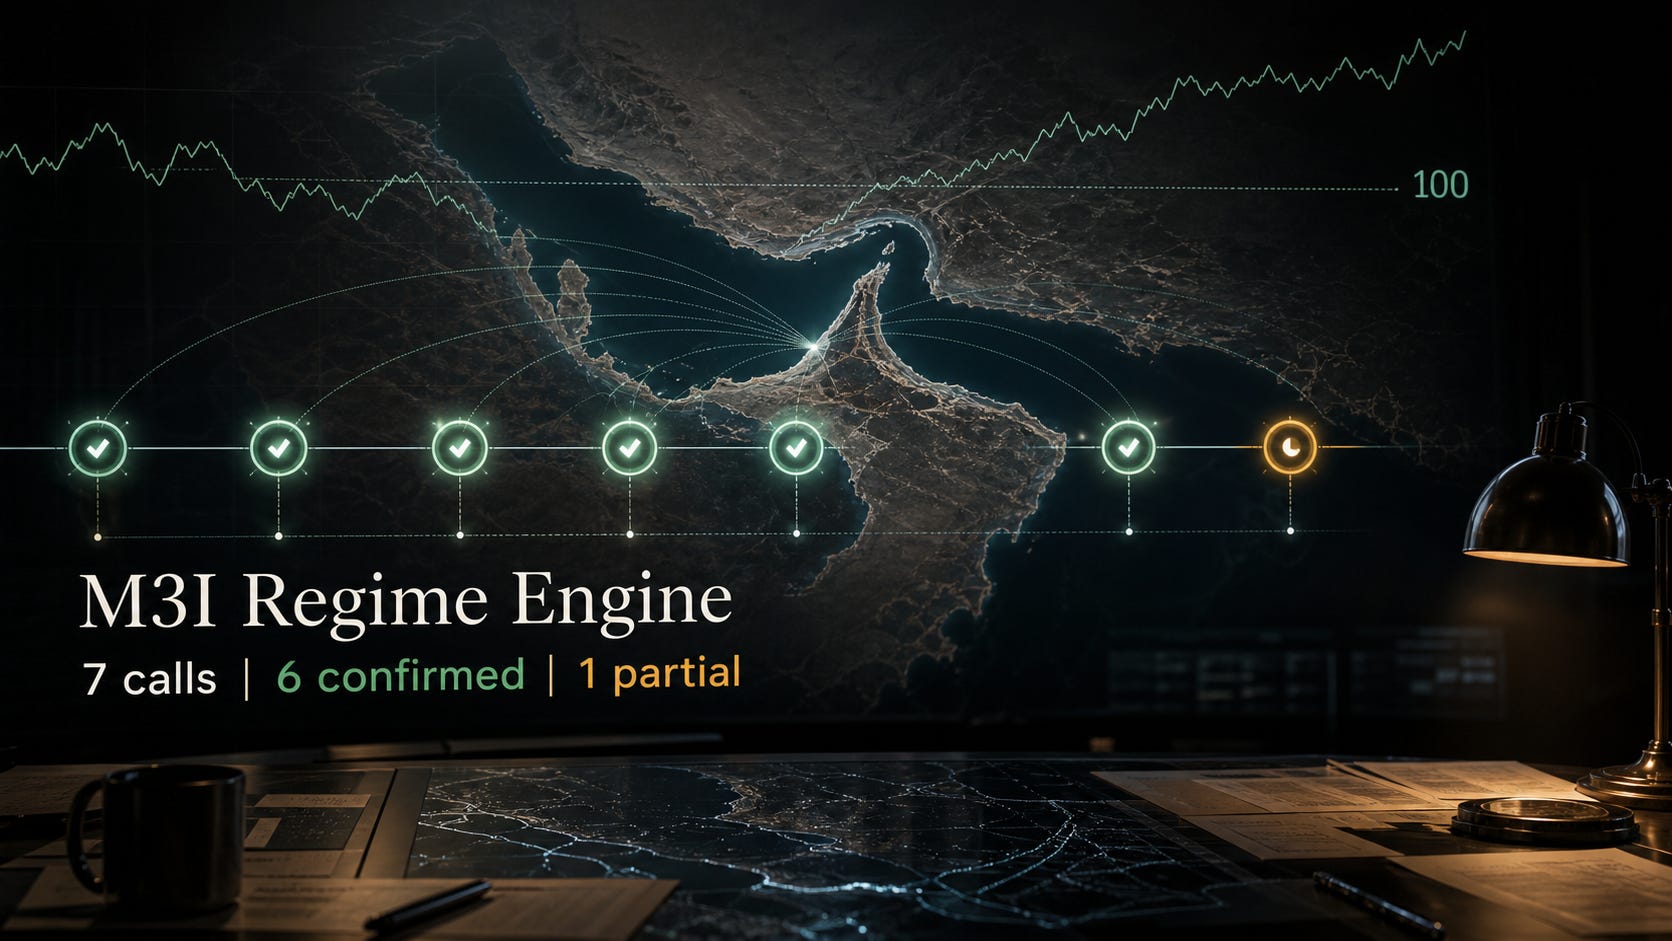
Before we go further into what the model is currently flagging, it’s worth establishing why we think this instrument is worth listening to. Over the 81 days since the Hormuz closure, the M3I regime engine has made seven documented, timestamped calls. Six were confirmed. One was partially confirmed. That’s not a claim of perfection — it’s a small sample in an unprecedented situation. But the specificity of the calls is what makes them notable.
Day 11 (March 10): The model assigned 42% probability to a negotiated deal by approximately April 14. At the time, no back-channel contact had been publicly confirmed. The ceasefire was announced April 7 — seven days ahead of the outer target window.
Day 30 (March 30): The model flagged oil above $100 as a regime-level signal. Brent hit $109 three days later.
Day 40 (April 9): Despite consensus that the Islamabad talks would produce a framework, the model assigned 81% probability to ceasefire collapse. Three days later, Vance departed Pakistan after 21 hours with no deal. The collapse risk reading was the correct one.
Day 45 (April 14): The model predicted the escalate-to-de-escalate pattern — ceasefire, failed talks, escalation, structured diplomatic process. The sequence played out over the following weeks almost exactly as modeled. The date target (framework by ~May 14–15) was missed, but the trajectory was right. We scored this as a partial confirmation.
The model’s timing can miss — Prediction #6 is proof of that. But what has been remarkable over 81 days is its ability to identify the correct pattern early: the right trajectory, the right sequence of events, the right structural read, often weeks before the consensus catches up. Six of seven timestamped calls confirmed in a crisis with no historical playbook. That’s not luck — it’s pattern recognition operating at a speed and scale that human analysis alone struggles to match. It’s earned, we think, a careful hearing for what it’s saying now.
—
What might explain the gap
There are a few reasonable explanations, and they’re not mutually exclusive.
Geopolitical stress is being absorbed elsewhere. Oil is at $108. Gold is above $4,500. The 10-year yield is 4.56%. It’s possible that the geopolitical premium is fully expressed in commodity and bond markets, leaving equity vol with less work to do. If that’s the case, the gap reflects rational market segmentation rather than complacency.
Equity markets are pricing a resolution. VIX is forward-looking in its own way — it reflects what traders expect over the next 30 days. If the consensus view is that diplomatic progress is likely (the Times of Israel reported last week that the US and Iran are “closing in on a framework”), then low VIX might reflect genuine optimism rather than ignorance.
VIX has a structural blind spot for geopolitical tail risk. This is the less comfortable possibility. Geopolitical events don’t have clean probability distributions. Options markets tend to underprice them until a specific catalyst forces a rapid reassessment. We’ve observed this pattern earlier in the crisis: VIX stayed below 20 for nearly three weeks while oil spiked 30% and shipping rates tripled. When the first kinetic event occurred, VIX gapped up roughly 40% in two sessions.
Possibly all three are partially true. What we do know is that the gap is historically unusual and the model believes that these events have tended to resolve within 2–4 weeks in prior instances.
—
What the AI regime engine sees
Our model runs a set of analytical routines on top of the raw scores to detect patterns and estimate probabilities. Here’s what it’s currently flagging, presented as observations rather than predictions:
Regime transition probability: 55%. The model estimates a 55% chance that the Score of Scores (currently 76, HIGH regime) drops below 70 within seven days. This is the highest transition reading since the closure began. The drivers: Turbulence has fallen 7 points, V-Shape Recovery has risen 5 points and crossed above 45, and the bull scenario probability sits at 18%. It doesn’t mean a transition will happen — it means the conditions that have historically preceded transitions are present.
Score momentum is mixed but tilting. Of the four core scores the model tracks (War Resolution, Turbulence, Escalation Risk, V-Shape Recovery), two are improving and two are deteriorating. But the magnitude differs: the improving scores moved 7 and 5 points respectively, while the deteriorating scores moved only 2 each. The model weighs velocity, not just direction.
Hormuz reopening remains unpriced. Hormuz Shipping sits at 85 with War Resolution at 23. The market is pricing near-zero probability of near-term reopening. That means the eventual repricing — whenever it comes — would be larger than if partial reopening were already reflected in asset prices. Historical parallels suggest oil adjustments of $15–25, significant shipping sector re-ratings, and VIX compression on credible reopening signals.
—
The scenario landscape
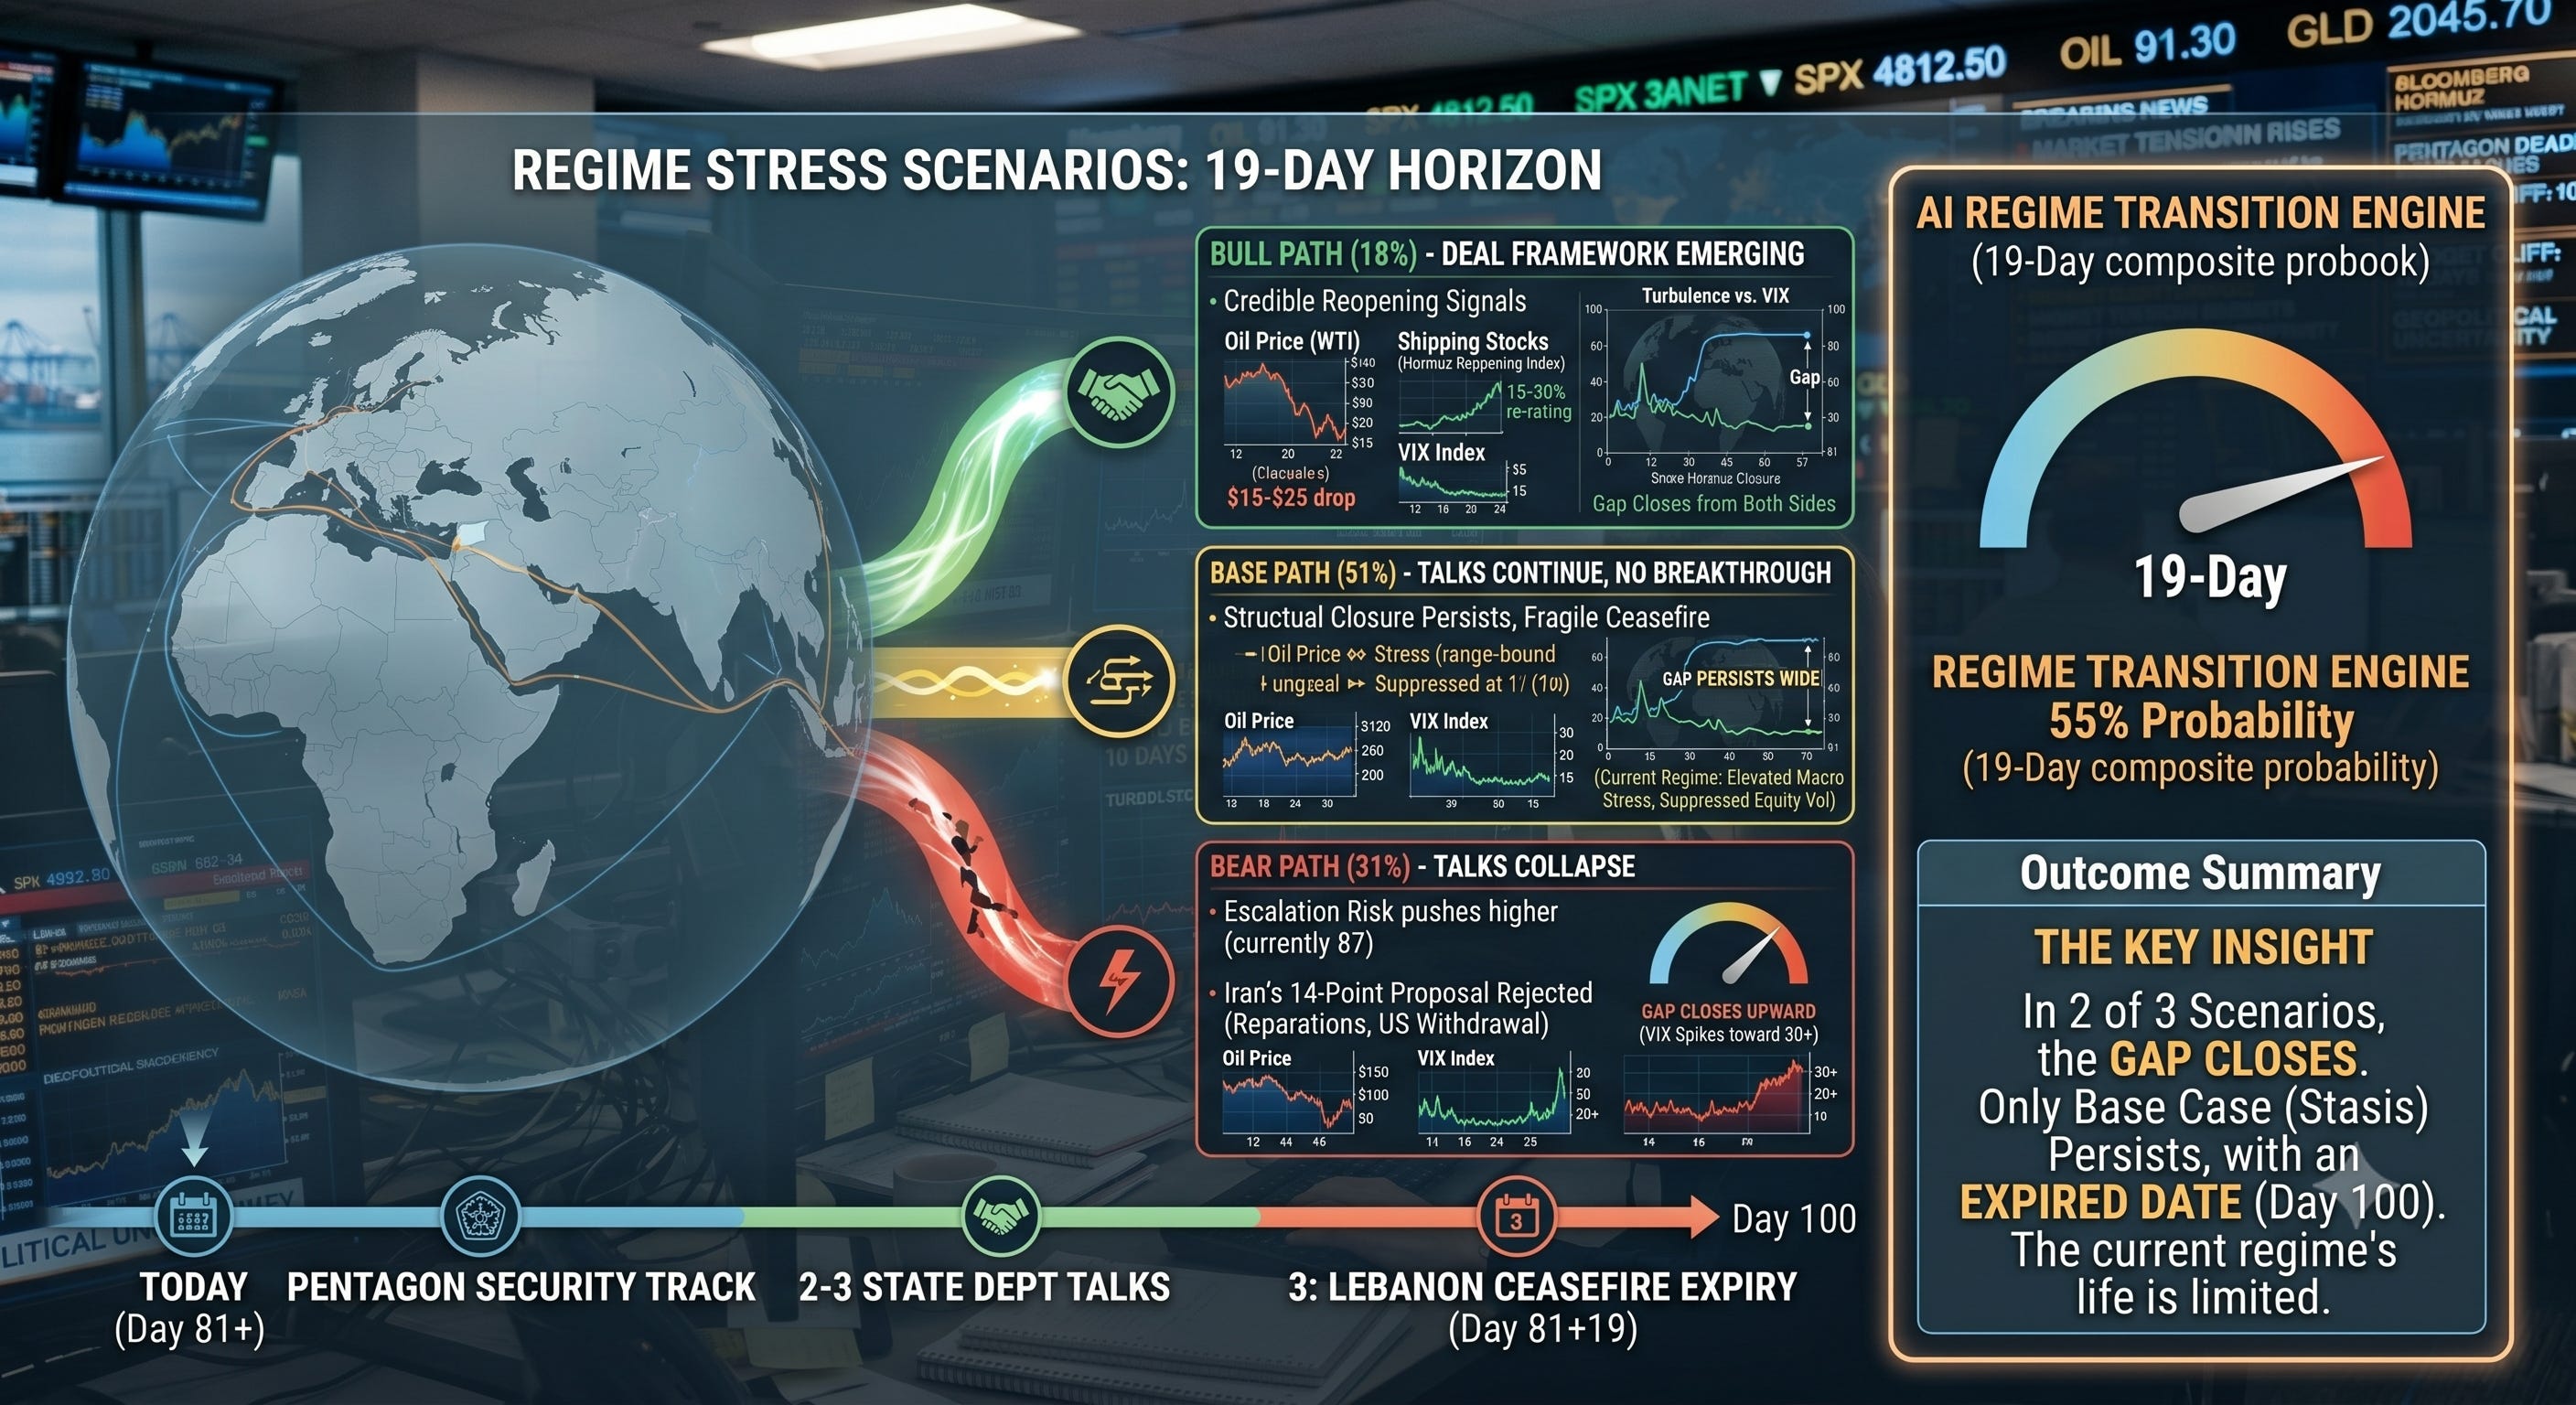
The model currently assigns probabilities to three primary paths. These aren’t predictions — they’re the model’s best estimate of the probability distribution based on current inputs:
Bull path (18%): A framework deal emerges from the May 29 Pentagon Security Track or June 2–3 State Department talks. Hormuz reopening process begins. In historical parallels, oil has dropped $15–25 in 48 hours on credible reopening signals, shipping stocks have re-rated 15–30%, and VIX has compressed below 15. The turbulence-VIX gap closes from both sides.
Base path (51%): Talks continue without breakthrough. Ceasefire holds but remains fragile. Structural closure persists. The turbulence-VIX gap remains wide. This is the current regime — elevated macro stress with suppressed equity vol. It can persist for weeks, but the concentration of three catalytic events in the next 19 days makes extended stasis less likely than it might otherwise be.
Bear path (31%): Talks collapse. Iran’s 14-point proposal (demanding reparations and US withdrawal) is rejected. Escalation risk, currently at 85, pushes higher. In this scenario, the turbulence-VIX gap closes upward — VIX spikes toward the model’s implied level of 30+. Oil breaks $120.
In two of three scenarios, the gap closes. The only scenario where it persists is the base case — and even that has an expiration date.
—
What’s ahead
Three events in the next 19 days could reshape the picture:
May 29 — Pentagon Security Track (10 days). The enrichment framework discussion. The most direct path to a regime change in the model.
June 2–3 — State Department Political Talks (14 days). Dual-track diplomacy convergence. Broader in scope than the Pentagon track.
June 7 — Lebanon-Israel Ceasefire Expiry (19 days). A second-front variable that could change the conflict geometry if not extended.
—
We track the turbulence-VIX gap, regime transition probabilities, score momentum, and cliff countdowns in real time at m3iresearch.com. The AI signal engine updates hourly. The site is live at m3iresearch.com
—
Disclaimer
M3I Research is for informational and educational purposes only. Nothing in this article constitutes financial, investment, legal, or tax advice. The scenario probabilities, model scores, and analysis are outputs of a proprietary research model and should not be relied upon as the sole basis for any investment decision. References to historical patterns and price movements describe past observations and do not guarantee future results. Geopolitical and macroeconomic events are inherently unpredictable. Always consult a qualified financial advisor before making investment decisions.