When Everyone Owns the Same Thing
The VIX said calm. Our Turbulence model said 90 — weeks before the AI selloff erased more than $1 trillion.

M3I Signal Note — June 9, 2026
Executive summary
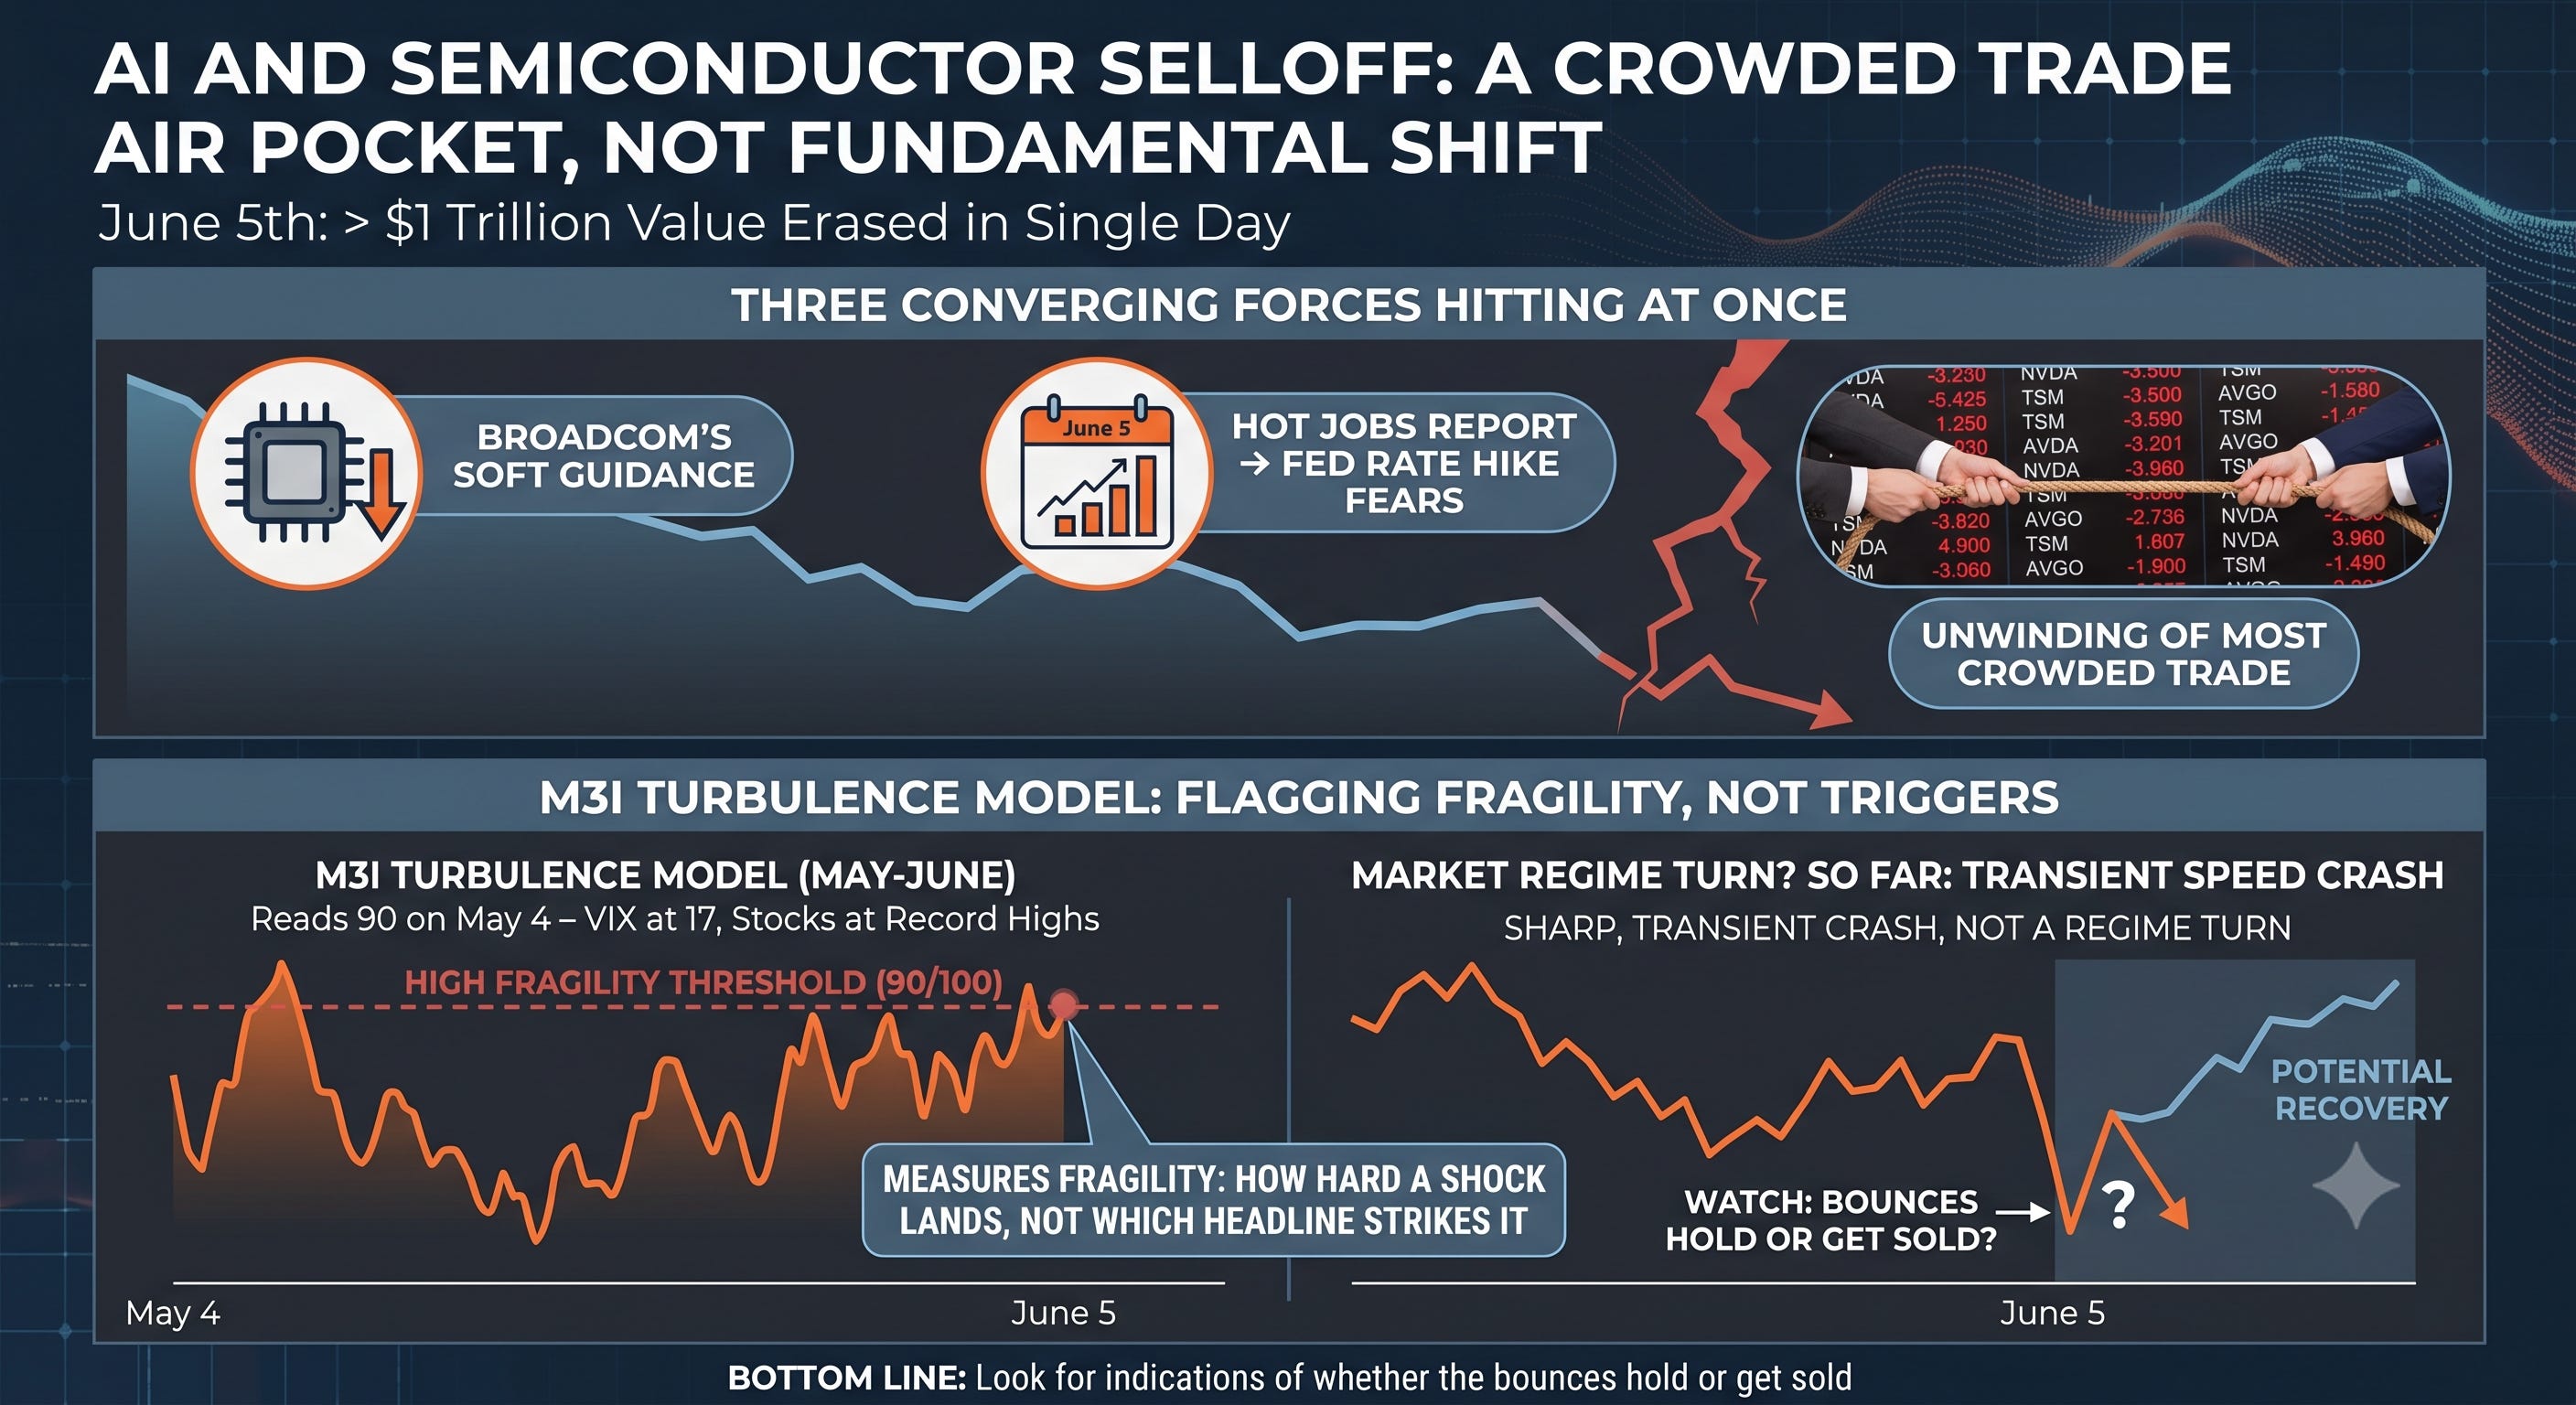
Friday’s (June 5) AI and semiconductor selloff erased more than $1 trillion — a crowded-trade air pocket, not a change in AI’s fundamentals.
Three forces hit at once: Broadcom’s soft guidance, a hot jobs report flipping the Fed toward rate hikes, and the most crowded trade on the Street unwinding.
M3I’s Turbulence model had flagged the fragility for weeks — reading 90 out of 100 on May 4, while the VIX sat at 17 and stocks were at record highs.
The model measures fragility, not the trigger: how hard a shock lands, not which headline strikes it.
Bottom line: so far this looks like a sharp, transient speed crash rather than a regime turn. Watch whether the bounces hold or get sold.
There is a kind of selloff that has very little to do with the thing being sold, and last Friday’s rout in AI and semiconductor stocks was one of them. Nothing about the long-run trajectory of artificial intelligence changed between Thursday and Friday. What changed was the price the market was willing to pay for it — and how many people happened to be standing on the same side of that price when it finally moved.
On Friday, June 5, the Philadelphia Semiconductor Index fell more than 10% in a single session, its worst day since 2020. More than $1 trillion in chip-sector value came off the board, Nvidia slipped back below a $5 trillion valuation, and the Nasdaq posted its worst day since the tariff shock of early 2025. By the size of the move it looked like a verdict on AI. It was really a verdict on positioning.
For two years, owning the companies that build the picks and shovels of AI had stopped being a thesis and become a reflex. The trade worked, so more capital flowed into it, which made it work again — the self-reinforcing loop that sits behind every crowded trade in history. The danger in a position everyone already owns is not that the story is wrong. It is that there is no marginal buyer left, so when sentiment turns, everyone reaches for the same exit at once.
Three things arrived at once
The spark was Broadcom. It reported, and it declined to raise its AI outlook. In a market priced for acceleration, merely excellent reads as disappointment.
Underneath that, the macro shifted. A hot jobs report — 172,000 against expectations of roughly 80,000 — pushed the conversation from rate cuts to rate hikes. The 10-year yield pressed above 4.5%, the 30-year above 5%. Higher-for-longer is a quiet tax on every company whose value sits far out in the future. AI infrastructure is the longest-duration bet on the board.
And then there was the crowd itself. When a trade becomes the most owned position on the Street, it stops needing bad news to fall. It only needs the buyers to pause. There was no one left to sell to at those prices, so the price went looking for a buyer. It found one a long way down.
This is an old story
Markets are people making decisions under uncertainty, and people have always herded. The railways, the radios, the dot-coms — every genuine technological revolution has been accompanied by a market that ran ahead of it and then, briefly, fell behind. The technology was real each time. The valuations were a separate question.
That distinction is the whole job. AI is not a hoax. But AI is transformative and these stocks are cheap are not the same sentence, and last week the market was reminded of the difference.
What the models were saying
We don’t claim to have called the day — the trigger is never knowable in advance. What is knowable is the setup, and M3I’s Turbulence model had been flagging it for weeks.
Go back to early May. The S&P was printing record highs. The VIX — the market’s fear gauge — had compressed to around 17, the very picture of calm. The tape was parabolic. And on May 4, M3I’s Turbulence model read 90 out of 100.
That gap is the entire point of the model. Turbulence is not the VIX. The VIX tells you how frightened people are right now. Turbulence tells you how fragile the structure underneath them is. In early May the two disagreed violently — fear said calm, fragility said danger — and fragility was right.
It wasn’t a one-day blip. The model never bought the calm the price action was selling. Turbulence sat at 82–83 through late April, spiked to 90 on May 4 while the VIX dozed near 17, and stayed elevated through the spring — pulling back only briefly in late May before climbing back into the high 80s as the selling began. Elevated almost the entire time. Chop expected the entire time.
The catalyst, when it finally came, was Broadcom and the Fed. It could have been almost anything — and that is exactly the case for measuring fragility instead of forecasting headlines. You don’t need to know which match gets struck to know the room has filled with gas. Our AI valuation work had been arguing the same thing from the other side: the more of the future you have already paid for, the less it takes to knock the price down.
This week, a match was struck.
None of this is a one-off. Six of our last seven geopolitical calls have confirmed — one partial — each posted in public, with a timestamp, before the fact. We publish the misses too. A forecast you can only see after it’s already right isn’t a forecast.
The speed-crash lens
The investor Jordi Visser has a useful name for this kind of move: a speed crash. His argument is that the old bubble playbook — built on slow human emotion, anchored memories, and information that traveled at the pace of a newspaper — no longer fits a market run by algorithms and passive flows. Information is instant now. So is the selling.
The result, in his framing, isn’t the slow multi-year bear of 2000. It’s a parabola that snaps — a sharp, violent, transient correction. He counts at least five V-shaped recoveries since 2018; the weakest of them still returned roughly 20% over the following year.
That cuts both ways, and it’s worth holding the tension. The same speed that makes these drops terrifying also makes them brief — which is why a speed crash is less an answer than a question: is this the exit from the trade, or the entry into the next leg? Visser’s own caution is that the real danger isn’t a valuation collapse but a speed crash triggered by the physical bottlenecks of the AI buildout — power, materials, capacity. The fragility is structural, not just emotional.
What to watch now
The honest question is whether this was a correction or a turn. So far it looks technical — the Nasdaq has already clawed back part of the move. The tells from here are simple:
A correction repairs quietly. Yields settle, the dip gets bought, breadth recovers. A turn does the opposite — each bounce gets sold, credit spreads widen, and the selling spreads from chips to the rest of the index.
We’ll be watching the same scores we always do, and we’ll tell you what they say. Not louder than the news. Just clearer.
This is the type of predictive intelligence M3I models run. One number for systemic risk, the models that move it underneath, and a public record you can check. We don’t shout over the news — we tell you, earlier and more plainly, how fragile the ground is.
See the live readings — Turbulence, the Score of Scores, and the full model stack — at m3iresearch.com. The daily briefing arrives every morning, free while we’re in beta.
Sourcing: Turbulence readings reflect M3I’s own model record — 82–83 in late April and 90 on May 4 (VIX near 17) are in our published history; later figures are from the live model. Market and macro figures reflect public reporting on the June 5, 2026 selloff. The speed-crash framing and V-shaped-recovery data are attributed to Jordi Visser (VisserLabs; TFTC interview); his views are his own.
Disclaimer
M3I Research publishes quantitative market and geopolitical risk commentary for informational and educational purposes only. Nothing in this note is investment, financial, legal, or tax advice, nor a recommendation, solicitation, or offer to buy or sell any security or other asset. It does not consider your individual objectives, financial situation, or risk tolerance.
The scores, models, and scenarios reflect M3I’s own methodology and opinions, are provided as is, and may be incomplete or wrong. They are not guarantees or predictions of future outcomes. Markets carry substantial risk, including the possible loss of principal. Past performance and prior model readings are not indicative of future results, and forward-looking statements are inherently uncertain.
Figures are drawn from M3I’s own model record and from public reporting believed to be reliable but not independently verified; data may be delayed, incomplete, or inaccurate. Third-party views referenced for context (including Jordi Visser’s) are their own and do not constitute endorsement. M3I Research and its operators may hold positions in the assets discussed.
Always do your own research and consult a licensed financial professional before making any investment decision. By reading this note you agree that M3I Research and its operators accept no liability for any loss or damage arising from its use.